Introduction
The landscape of web development has evolved dramatically over the last decade. What began as simple text editors and basic HTML has blossomed into a sophisticated ecosystem of frameworks, preprocessors, containerization, and automated pipelines. Today, a developer’s efficiency is often defined not just by their coding ability, but by their mastery of Web Development Tools. From initial code composition to Production Debugging, the right set of utilities can exponentially increase productivity and code quality.
Modern applications require a robust approach to Software Debugging and maintenance. Whether you are engaged in Full Stack Debugging or focused on a specific niche like React Debugging or Python Development, the complexity of distributed systems and asynchronous data flows demands powerful introspection tools. It is no longer sufficient to rely solely on print statements; developers must leverage integrated environments, Static Analysis, and real-time performance monitors to ensure application stability.
This article provides an in-depth exploration of the essential tools and techniques required for modern web development. We will cover the spectrum from code quality enforcement to advanced API Debugging and Error Tracking strategies, providing you with actionable insights to refine your workflow and tackle complex Software Debugging challenges effectively.
Section 1: The Foundation – Code Quality and Static Analysis
Before a single line of code is executed in a browser or on a server, it should pass through a rigorous quality check. Static Analysis tools are the first line of defense in Application Debugging. They analyze source code without executing it, identifying potential JavaScript Errors, style violations, and anti-patterns that could lead to runtime failures.
Linting and Formatting
In the realm of JavaScript Development and TypeScript Debugging, tools like ESLint and Prettier are indispensable. ESLint allows developers to define a set of rules that the code must adhere to, catching variable scope issues and unused arguments before they become bugs. Similarly, in Python Development, tools like Pylint and Flake8 serve the same purpose.
Integrating these tools into your IDE (such as VS Code) provides immediate feedback. This “Shift Left” approach to Bug Fixing reduces the cost of errors by catching them during the development phase rather than in production. Below is an example of a configuration for a modern JavaScript project that enforces strict type checking and best practices.
{
  "extends": [
    "eslint:recommended",
    "plugin:@typescript-eslint/recommended",
    "plugin:react/recommended"
  ],
  "parser": "@typescript-eslint/parser",
  "plugins": ["@typescript-eslint", "react"],
  "rules": {
    "no-console": "warn",
    "no-unused-vars": "off",
    "@typescript-eslint/no-unused-vars": ["error"],
    "react/prop-types": "off",
    "eqeqeq": ["error", "always"],
    "curly": "error"
  },
  "env": {
    "browser": true,
    "node": true,
    "es6": true
  }
}
Type Safety as a Tool
TypeScript Debugging has become a core skill because TypeScript itself acts as a powerful development tool. By enforcing static typing, it eliminates an entire class of JavaScript Errors related to type coercion and undefined properties. When configured correctly, the TypeScript compiler acts as a preemptive debugger, preventing invalid code from ever reaching the build step.
Section 2: Frontend Implementation and Browser Debugging
Once the code is written, the focus shifts to the runtime environment. For frontend developers, the browser is the operating system. Chrome DevTools remains the gold standard for Browser Debugging, offering deep insights into the DOM, network activity, and JavaScript execution.
Advanced Console and Breakpoints
While `console.log` is the most common form of Code Debugging, it is often inefficient for complex objects. Modern browsers support advanced logging methods like `console.table` for arrays and `console.group` for organizing output. However, the true power lies in the Debug Console and breakpoints. Using the `debugger` statement or setting conditional breakpoints in the “Sources” tab allows you to pause execution and inspect the call stack, scope variables, and closure states in real-time.
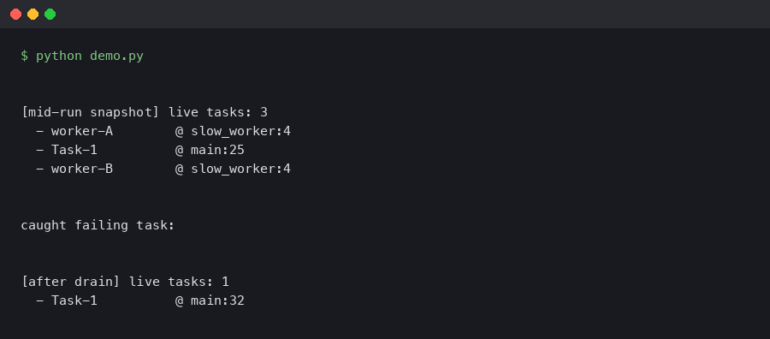
This is critical for Async Debugging, where tracking the flow of Promises and `async/await` functions can be disorienting. Here is a practical example of how to implement structured logging and debugging triggers in a React component to assist with React Debugging.
import React, { useState, useEffect } from 'react';

const UserDashboard = ({ userId }) => {
  const [userData, setUserData] = useState(null);
  const [error, setError] = useState(null);

  useEffect(() => {
    const fetchData = async () => {
      console.time("API_Fetch_Duration"); // Performance Monitoring
      try {
        const response = await fetch(`https://api.example.com/users/${userId}`);

        if (!response.ok) {
          throw new Error(`HTTP error! status: ${response.status}`);
        }

        const data = await response.json();

        // Conditional breakpoint logic for Debugging
        if (data.isAdmin) {
            // This will pause execution only if DevTools is open
            debugger;
        }

        console.table(data.permissions); // Visualizing complex data
        setUserData(data);
      } catch (err) {
        console.error("Fetch failed:", err);
        setError(err.message);
      } finally {
        console.timeEnd("API_Fetch_Duration");
      }
    };

    fetchData();
  }, [userId]);

  if (error) return <div>Error: {error}</div>;
  if (!userData) return <div>Loading...</div>;

  return <div>Welcome, {userData.name}</div>;
};

export default UserDashboard;
Performance Profiling
Debug Performance tools within the browser, such as Lighthouse and the Performance tab, are essential for identifying bottlenecks. They help visualize the critical rendering path, script execution time, and layout thrashing. For frameworks like Vue or Angular, using specific extensions (Vue DevTools, Angular DevTools) provides a component-tree view that standard Web Debugging tools lack, making Vue Debugging and Angular Debugging significantly more intuitive.
Section 3: Backend, API, and Infrastructure Tools
Moving to the server side, Node.js Debugging and Python Debugging require a different set of utilities. Since there is no DOM, developers rely heavily on logging frameworks, remote debuggers, and API clients.
API Development and Testing
API Development is a cornerstone of modern web apps. Tools like Postman, Insomnia, and Swagger are critical for API Debugging. They allow developers to craft HTTP requests, inspect headers, and validate JSON responses independently of the frontend. This isolation is crucial for Unit Test Debugging and ensuring that the backend contract is honored.
For Node.js Development, understanding the event loop is vital. When dealing with Express Debugging, middleware errors can often be swallowed if not handled correctly. Utilizing libraries like `debug` or robust loggers like Winston helps create readable Stack Traces.
Containerization and Remote Debugging
In the era of microservices, Docker Debugging and Kubernetes Debugging are essential skills. Code that runs locally might fail in a container due to environment differences. Attaching a debugger to a running Docker container allows for Remote Debugging, bridging the gap between local dev and production environments.
Below is a Python example using Flask, demonstrating proper error handling and logging configuration, which is essential for Django Debugging or Flask Debugging contexts where Python Errors must be captured systematically.
import logging
from flask import Flask, jsonify, request
import traceback

app = Flask(__name__)

# Configure Logging for Production Debugging
logging.basicConfig(
    level=logging.INFO,
    format='%(asctime)s - %(name)s - %(levelname)s - %(message)s',
    handlers=[
        logging.FileHandler("app_errors.log"),
        logging.StreamHandler()
    ]
)
logger = logging.getLogger(__name__)

@app.route('/api/process', methods=['POST'])
def process_data():
    try:
        data = request.get_json()
        if not data or 'payload' not in data:
            logger.warning("Invalid input received: %s", data)
            return jsonify({"error": "Missing payload"}), 400

        # Simulate complex logic
        result = perform_calculation(data['payload'])
        return jsonify({"result": result}), 200

    except Exception as e:
        # Capture full Stack Traces for analysis
        logger.error("Unhandled Exception: %s", str(e))
        logger.error(traceback.format_exc())
        return jsonify({"error": "Internal Server Error"}), 500

def perform_calculation(val):
    # Intentional bug for demonstration
    return 100 / int(val)

if __name__ == '__main__':
    # Enable built-in debugger for development
    app.run(debug=True, port=5000)
Section 4: Advanced Techniques and Best Practices
To truly master Web Development Tools, one must look beyond code creation and focus on System Debugging and lifecycle management. This involves CI/CD Debugging, automated testing, and proactive monitoring.
Error Monitoring and Tracking
Production Debugging is the most high-stakes form of debugging. When a user encounters a bug, you cannot rely on them to send a screenshot of the console. Tools like Sentry, LogRocket, and Datadog provide real-time Error Monitoring. They capture the state of the application, the Stack Traces, and even user session replays the moment a crash occurs. This is vital for Mobile Debugging and web apps alike, where device fragmentation causes unique issues.
Memory and Network Analysis
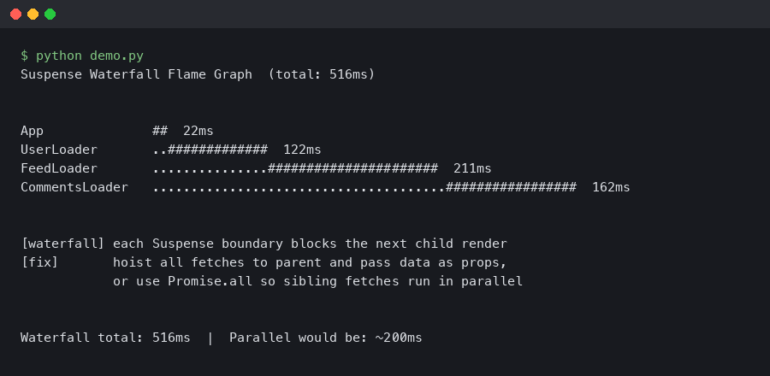
Memory Debugging is often overlooked until an application crashes. Chrome DevTools offers a “Memory” tab to take heap snapshots and identify memory leaks—common in Single Page Applications (SPAs). Similarly, Network Debugging involves analyzing waterfall charts to optimize load times. Tools like Wireshark or Charles Proxy can be used for lower-level packet inspection, which is useful when debugging WebSocket connections or complex Microservices Debugging scenarios.
Automated Testing Integration
Testing and Debugging go hand in hand. Integrating unit tests (Jest, Mocha, PyTest) and end-to-end tests (Cypress, Selenium) into your workflow ensures that Bug Fixing doesn’t introduce regressions. Debug Automation through CI/CD pipelines ensures that code is analyzed and tested before deployment.
Here is an example of a simple Node.js test setup that aids in Integration Debugging by verifying API responses programmatically.
const request = require('supertest');
const app = require('../app'); // Importing the Express app

describe('POST /api/users', () => {
  it('should create a new user and return 201 status', async () => {
    const res = await request(app)
      .post('/api/users')
      .send({
        username: 'dev_tester',
        email: '[email protected]'
      });

    // Assertions help pinpoint where logic fails
    expect(res.statusCode).toEqual(201);
    expect(res.body).toHaveProperty('id');
  });

  it('should return 400 for missing required fields', async () => {
    const res = await request(app)
      .post('/api/users')
      .send({
        username: 'dev_tester'
        // Missing email
      });

    expect(res.statusCode).toEqual(400);
    // Useful for API Debugging to ensure error messages are descriptive
    expect(res.body.error).toContain('Email is required');
  });
});
Conclusion
The domain of Web Development Tools is vast and ever-expanding. From the moment you write a line of code in an IDE equipped with Static Analysis, to the point where you are analyzing Error Messages in a production monitoring dashboard, tools are the leverage that allows modern developers to build complex, reliable systems. Mastering Debugging Techniques—whether it be JavaScript Debugging in the browser, Node.js Debugging on the server, or Docker Debugging in the cloud—is what separates a junior coder from a senior software engineer.
As you progress, remember that tools are means to an end. The goal is to write clean, maintainable, and performant code. By integrating Performance Monitoring, automated testing, and robust Logging and Debugging practices into your daily workflow, you ensure that you are not just fixing bugs, but preventing them. Continue to explore new libraries, stay updated with Developer Tools enhancements, and always prioritize the stability and user experience of your applications.

