

In modern software development, applications are rarely monolithic islands. They are interconnected systems, constantly communicating across networks. A frontend built with React or Vue talks to a backend API, which in turn might query a database or call other microservices. When something goes wrong—a button doesn’t work, data fails to load, or a form submission hangs indefinitely—the root cause often lies hidden within these network communications. This is where network debugging becomes an indispensable skill for every developer.
Effective network debugging is the art and science of inspecting, analyzing, and resolving issues in the data exchange between clients and servers. It’s about understanding the conversation happening under the hood. Without this skill, developers are left guessing, leading to wasted hours and frustrating bug-fixing cycles. This comprehensive guide will walk you through the core concepts, practical tools, and advanced techniques for mastering network debugging, transforming you from a hopeful code-fixer into a systematic problem-solver.
Understanding the Fundamentals of Network Communication
Before diving into specific tools, it’s crucial to understand what you’re looking for. Every network interaction in web development, from loading an image to submitting a form, is typically an HTTP(S) request-response cycle. Mastering network debugging means knowing how to dissect this cycle.
The Anatomy of an HTTP Request/Response
An HTTP cycle consists of two main parts:
- The Request: Sent from the client (e.g., your browser) to the server. It includes a method (GET, POST, PUT, DELETE), a target URL, headers (metadata like authentication tokens or content type), and an optional body (the data being sent, like form inputs).
- The Response: Sent from the server back to the client. It includes a status code (e.g., 200 OK, 404 Not Found, 500 Internal Server Error), headers, and an optional body (the requested data, like a JSON object or HTML page).
The first step in any Web Debugging process is to check these components. Is the request URL correct? Is the method right? Is the authentication header present? Did the server respond with an error code? Is the response body what you expected?
Essential Tools: Browser DevTools and cURL
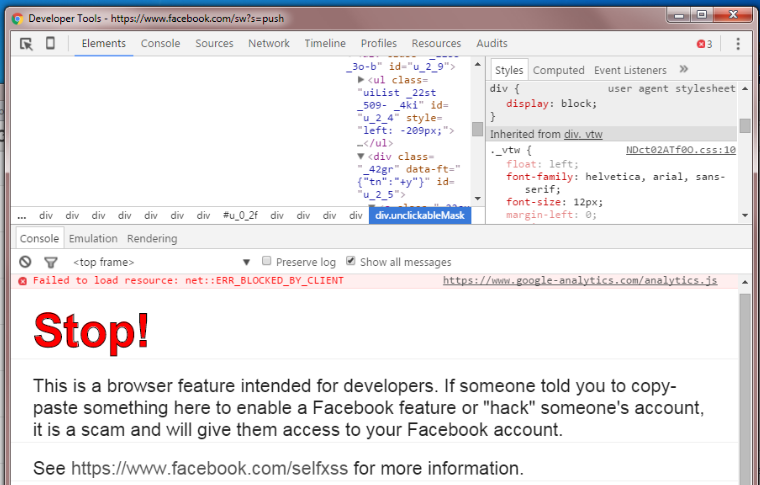
Your browser’s developer tools are the frontline of Frontend Debugging. The “Network” tab is your command center, showing every single request your application makes. You can inspect headers, view payloads, check status codes, and analyze timing information. It’s the most powerful tool for initial diagnosis.
For API Debugging and backend testing, curl is a versatile command-line tool that allows you to craft and send HTTP requests directly from your terminal, bypassing the frontend entirely. This helps isolate whether a problem is in the client-side code or the backend service.
Here’s a simple curl command to send a POST request with a JSON payload, a common task in API Development:
# Sending a POST request to a test API endpoint
# -X POST specifies the HTTP method
# -H sets a request header (in this case, the content type)
# -d specifies the request body (data)

curl -X POST \
  https://api.example.com/users \
  -H 'Content-Type: application/json' \
  -d '{
    "username": "testuser",
    "email": "test@example.com"
  }'
Using curl lets you verify backend behavior independently, which is a core principle of effective Full Stack Debugging.
Practical Debugging Scenarios and Techniques
Theory is great, but debugging is a hands-on activity. Let’s explore common scenarios and the practical steps to resolve them, covering both client-side and server-side perspectives.
Client-Side Debugging with JavaScript and Chrome DevTools
Imagine a feature where a user clicks a button to fetch data from an API, but nothing appears on the screen. The issue could be in the JavaScript code, the network request, or the server’s response.
First, let’s look at the client-side JavaScript code that makes the request:
async function fetchUserData(userId) {
  try {
    const response = await fetch(`https://api.example.com/users/${userId}`);

    // A common mistake: not checking if the response was successful
    if (!response.ok) {
      // For 4xx/5xx errors, fetch() doesn't throw an error, so we must check response.ok
      console.error(`Error fetching data: ${response.status} ${response.statusText}`);
      const errorBody = await response.text();
      console.error(`Server response: ${errorBody}`);
      return;
    }

    const data = await response.json();
    console.log('User data received:', data);
    // Code to update the UI would go here
  } catch (error) {
    // This catches network failures (e.g., no internet, DNS issues)
    console.error('A network error occurred:', error);
  }
}

// Simulate a button click
fetchUserData(123);
To debug this, you would:
- Open Chrome DevTools: Press F12 or Ctrl+Shift+I.
- Go to the “Network” Tab: Make sure “Preserve log” is checked if the page reloads.
- Trigger the Action: Click the button that calls
fetchUserData. - Inspect the Request: Find the request to
api.example.com/users/123in the list. Click on it. - Analyze the Tabs:
- Headers: Verify the Request URL, Request Method, and Status Code. A
404 Not Foundmeans the URL is wrong. A403 Forbiddensuggests an authentication issue. - Preview/Response: Look at the raw response from the server. Is it the JSON you expected, or is it an HTML error page or a JSON object with an error message?
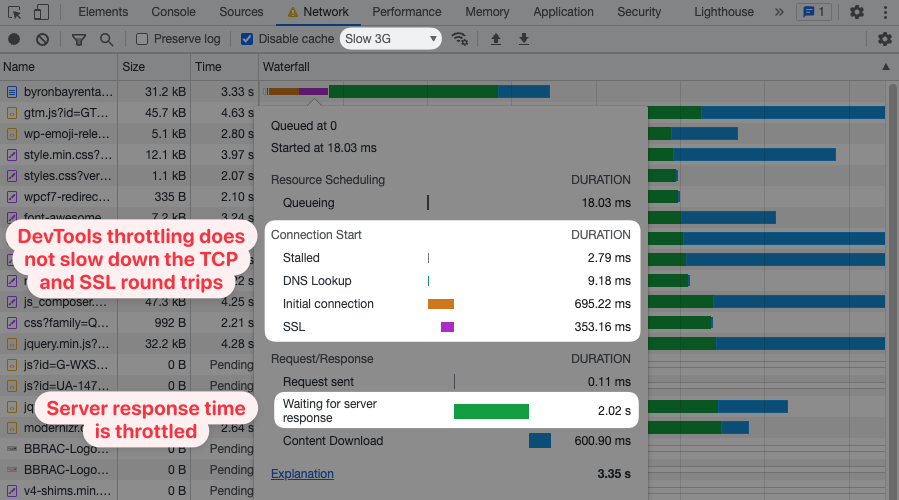
- Timing: See how long the request took. A long “Waiting (TTFB)” time points to a slow backend.
- Headers: Verify the Request URL, Request Method, and Status Code. A
This systematic approach, combining code inspection and using Browser Debugging tools, quickly narrows down the problem’s location.
Server-Side Debugging with Node.js and Logging
Now, let’s say the browser inspection shows a 500 Internal Server Error. The problem is on the backend. The key to Backend Debugging is effective logging. You need to see what the server received and what it tried to do.
Here’s a simple Express.js (a popular Node.js Development framework) middleware for logging incoming requests. This kind of detailed logging is crucial for Node.js Debugging.
const express = require('express');
const app = express();

// Middleware to log every incoming request
const requestLogger = (req, res, next) => {
  console.log('--- New Request ---');
  console.log(`Timestamp: ${new Date().toISOString()}`);
  console.log(`Method: ${req.method}`);
  console.log(`URL: ${req.originalUrl}`);
  console.log('Headers:', req.headers);

  // For POST/PUT requests, we might want to log the body
  if (['POST', 'PUT'].includes(req.method)) {
    // Note: This requires a body-parser middleware like express.json() to be used before this logger
    console.log('Body:', req.body);
  }

  next(); // Pass control to the next handler
};

app.use(express.json()); // Middleware to parse JSON bodies
app.use(requestLogger); // Use our custom logger middleware

// Example route
app.get('/users/:id', (req, res) => {
  // ... logic to fetch user ...
  if (userNotFound) {
    return res.status(404).json({ error: 'User not found' });
  }
  res.json({ id: req.params.id, name: 'Jane Doe' });
});

app.listen(3000, () => {
  console.log('Server listening on port 3000');
});
With this middleware in place, every API call will print detailed information to your server console. When you see a 500 error, you can check the logs to see the exact headers and body that caused the server to crash. This is a fundamental practice in Express Debugging and general server-side Error Tracking.
Advanced Network Debugging Techniques
Some network issues are more complex and require advanced tools and knowledge. Scenarios like cross-origin requests, debugging on remote environments, and tracing requests through microservices demand a deeper understanding.
Tackling CORS (Cross-Origin Resource Sharing) Errors
A CORS error is one of the most common JavaScript Errors developers face when building APIs. It happens when a web page at one domain tries to make a request to a server at a different domain. The browser, for security reasons, blocks this unless the server explicitly allows it via specific HTTP headers.
When you see a CORS error in the Debug Console, check the Network tab for a “preflight” request. This is an OPTIONS request the browser sends before the actual GET or POST request to ask the server for permission. The server must respond to this OPTIONS request with the correct headers, like Access-Control-Allow-Origin, Access-Control-Allow-Methods, and Access-Control-Allow-Headers.
Remote and Production Debugging
What if a bug only occurs in the production environment? You can’t just attach a debugger. This is where Remote Debugging techniques and tools come in. One invaluable tool is ngrok, which creates a secure tunnel from the public internet to a port on your local machine. This is perfect for:
- Testing Webhooks: Services like Stripe or GitHub send webhooks to your server. With
ngrok, you can direct them to your local development machine to debug the code in real-time. - Mobile Debugging: A mobile app can be configured to send API requests to the public
ngrokURL, allowing you to debug the backend code running locally.
Debugging in a Microservices Architecture
In a microservices environment, a single user action might trigger a chain of network requests across multiple services. If one service fails, it can be incredibly difficult to trace the original request. This is where distributed tracing comes in. The concept is to pass a unique “trace ID” or “correlation ID” in the headers of every request in the chain. All logs for that chain are then tagged with this ID, allowing you to use tools like Jaeger or OpenTelemetry to visualize the entire request flow and pinpoint which service failed. This is an advanced but essential technique for Microservices Debugging.
Best Practices for Proactive Network Debugging
The best way to fix bugs is to prevent them. Adopting a set of best practices can make network issues easier to diagnose and resolve when they do occur.
Implement Structured Logging
Plain text logs are hard to search and analyze. Structured logging (e.g., logging in JSON format) is a game-changer. It makes your logs machine-readable, so you can easily filter and query them using log management tools like Datadog, Splunk, or the ELK Stack.
Here’s a simple Python Debugging example using Flask and the python-json-logger library:
from flask import Flask, request
import logging
from pythonjsonlogger import jsonlogger

app = Flask(__name__)

# Configure logging
logHandler = logging.StreamHandler()
formatter = jsonlogger.JsonFormatter('%(asctime)s %(name)s %(levelname)s %(message)s')
logHandler.setFormatter(formatter)
logger = logging.getLogger()
logger.addHandler(logHandler)
logger.setLevel(logging.INFO)

@app.before_request
def log_request_info():
    logger.info('Incoming request', extra={
        'request_method': request.method,
        'request_url': request.url,
        'remote_addr': request.remote_addr,
        'request_headers': dict(request.headers)
    })

@app.route('/')
def hello_world():
    logger.info('Processing root endpoint')
    return 'Hello, World!'

if __name__ == '__main__':
    app.run(debug=True)
This code ensures every request is logged as a structured JSON object, making Error Monitoring and analysis significantly more efficient, especially in a Production Debugging context.
Write Comprehensive Integration Tests
Testing and Debugging go hand-in-hand. Integration tests verify the communication between different parts of your system, including network calls. Write tests that simulate real API calls and assert the expected status codes, headers, and response bodies. This practice, especially when integrated into a CI/CD Debugging pipeline, can catch network-related regressions before they ever reach users.
Monitor Network Performance
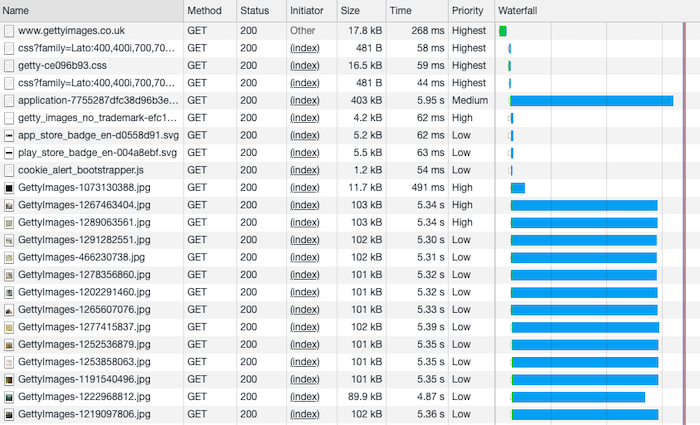
Network debugging isn’t just for fixing errors; it’s also for optimizing performance. Use the “Waterfall” view in your browser’s Network tab to analyze resource loading times. Identify slow API endpoints, unoptimized images, or large JavaScript bundles that are slowing down your application. Tools for Performance Monitoring can provide deep insights into your application’s network behavior over time, helping you address performance bottlenecks proactively.
Conclusion
Network debugging is a critical skill that separates proficient developers from the rest. It’s a systematic process that involves understanding the fundamentals of HTTP, mastering tools like browser DevTools and curl, and applying logical deduction to isolate problems. By starting with the client, inspecting the network conversation, and then moving to the server with robust logging, you can tackle almost any network-related issue.
Embrace advanced techniques like distributed tracing for complex architectures and adopt best practices like structured logging and integration testing. By making network analysis a core part of your development workflow, you’ll not only fix bugs faster but also build more resilient, performant, and reliable applications.