Bugs are an inevitable part of software development. Whether you’re a seasoned engineer building complex microservices or a data scientist wrangling a new machine learning model, you will spend a significant amount of time hunting down and fixing errors. While the humble print() statement has served many developers well, the Python ecosystem offers a powerful and sophisticated suite of tools and techniques for effective code debugging. Mastering these tools can dramatically reduce the time spent on bug fixing, improve code quality, and ultimately make you a more productive and confident developer.
This comprehensive guide will take you on a journey through the world of Python debugging. We’ll start with the fundamental concepts, move on to interactive debuggers, explore advanced scenarios like remote and framework-specific debugging, and conclude with best practices to integrate into your daily workflow. By the end, you’ll be equipped with the knowledge to tackle even the most elusive Python errors with precision and efficiency, turning frustrating debugging sessions into valuable learning opportunities.
The Foundations: Beyond Print Statements
Every developer’s journey into debugging begins with inserting print statements to inspect the state of variables. While quick and easy, this approach is inefficient, clutters your code, and becomes unmanageable in complex applications. Let’s explore two foundational techniques that provide a more structured and powerful alternative.
Embracing the `logging` Module
The built-in logging module is the professional standard for emitting diagnostic messages from your application. Unlike print(), it allows you to categorize messages by severity (e.g., DEBUG, INFO, WARNING, ERROR, CRITICAL), control their verbosity, and direct output to various destinations like the console, files, or network streams without changing your application code.
This separation of concerns is crucial. You can leave detailed debug messages in your code and configure the logger to only show them in a development environment, while in production, you might only log WARNING level messages and above. This provides insight without performance overhead or noisy logs.
import logging
import sys

# Configure the logger
# In a real application, this configuration might come from a file
logging.basicConfig(
    level=logging.DEBUG,  # Set the lowest level to capture all messages
    format='%(asctime)s - %(name)s - %(levelname)s - %(message)s',
    handlers=[
        logging.FileHandler("app.log"), # Log to a file
        logging.StreamHandler(sys.stdout) # Also log to the console
    ]
)

logger = logging.getLogger(__name__)

def process_data(data):
    """Processes a list of user data dictionaries."""
    logger.info(f"Starting data processing for {len(data)} records.")
    processed_users = []
    for i, user in enumerate(data):
        logger.debug(f"Processing record #{i}: {user}")
        try:
            # A potential bug: 'name' key might be missing
            full_name = f"{user['first_name']} {user['last_name']}"
            user['full_name'] = full_name
            processed_users.append(user)
        except KeyError as e:
            logger.error(f"Missing key in record #{i}: {e}. Record: {user}")
            # Decide how to handle the error: skip, default, etc.
            continue
    logger.info("Data processing finished.")
    return processed_users

if __name__ == "__main__":
    users = [
        {'first_name': 'Ada', 'last_name': 'Lovelace', 'id': 1},
        {'first_name': 'Grace', 'last_name': 'Hopper', 'id': 2},
        {'name': 'Charles Babbage', 'id': 3} # This record is malformed
    ]
    process_data(users)
Running this script will produce clean, timestamped output in both the console and the `app.log` file, clearly identifying the problematic record without halting execution.
Interactive Debugging with PDB
When logging isn’t enough and you need to inspect the application’s state at a specific moment, an interactive debugger is your best friend. Python’s standard library includes its own debugger, `pdb`. It allows you to pause your code’s execution at any point, examine variables, execute new code in the current scope, and step through your program line by line.
Getting Started with `pdb`
The most common way to use `pdb` is to insert a “breakpoint” in your code. This is done by adding `import pdb; pdb.set_trace()` where you want the execution to pause.
Let’s debug a function with a subtle logic error. This function is supposed to calculate the average price of items after applying a discount, but it’s producing the wrong result.

Developer looking at code with errors – 10 Best ChatGPT Prompts for Coders/Developers in 2024 – GeeksforGeeks
import pdb

def calculate_average_discounted_price(items, discount_percentage):
    """
    Calculates the average price of items after applying a discount.
    There is a logical bug here!
    """
    total_price = 0
    for item in items:
        discount_amount = item['price'] * discount_percentage
        discounted_price = item['price'] - discount_amount
        total_price += item['price'] # BUG: Should be adding discounted_price

    # Set a breakpoint right before the final calculation to inspect the state
    pdb.set_trace()

    if not items:
        return 0

    average_price = total_price / len(items)
    return average_price

if __name__ == "__main__":
    products = [
        {'name': 'Laptop', 'price': 1200},
        {'name': 'Mouse', 'price': 50},
        {'name': 'Keyboard', 'price': 100}
    ]

    # We expect an average around 1012.5, but we'll get something else.
    result = calculate_average_discounted_price(products, 0.25)
    print(f"The final average price is: {result}")
When you run this script, execution will halt where `pdb.set_trace()` is called, and you’ll be dropped into a `(Pdb)` prompt. Here are some essential commands:
- `l` (list): Shows the source code around the current line.
- `n` (next): Executes the current line and moves to the next line in the same function.
- `s` (step): Executes the current line and steps into any function call.
- `c` (continue): Resumes normal execution until the next breakpoint.
- `p <variable>` (print): Evaluates and prints the value of a variable. For example, `p total_price`.
- `q` (quit): Exits the debugger and terminates the script.
At the prompt, if we type `p total_price`, we would see `1350` (the sum of the original prices), not the discounted total. This immediately reveals our bug: we were adding `item[‘price’]` instead of `discounted_price` to the total. This kind of interactive inspection is invaluable for understanding complex program flow and state.
Advanced Debugging: IDEs, Remote Sessions, and Frameworks
As your projects grow in complexity, you’ll benefit from more advanced tools that integrate seamlessly into your development environment. Modern IDEs and specialized libraries offer powerful features for debugging everything from web APIs to distributed systems.
Leveraging IDE Debuggers (VS Code, PyCharm)
Integrated Development Environments (IDEs) like Visual Studio Code and PyCharm provide a graphical interface for debugging that builds upon the concepts of `pdb`. Instead of writing `pdb.set_trace()`, you click in the editor’s gutter to set a visual breakpoint. When the code runs, it pauses at that line, and the IDE presents you with a rich debugging panel.
This panel typically includes:
- Variables View: A live view of all local and global variables and their current values.
- Watch Expressions: A place to enter custom expressions that are continuously evaluated.
- Call Stack: A tree showing the function call hierarchy that led to the current point, allowing you to jump between frames.
- Debug Console: An interactive console (like `pdb`) where you can execute arbitrary code in the current context.
This visual approach makes it much easier to track state changes and understand the program’s execution path without memorizing command-line instructions.
Remote Debugging for Servers and Containers
What if your code isn’t running on your local machine? This is common in modern web development, microservices, and CI/CD pipelines where code runs on a server, in a Docker container, or even on a different node in a cluster. This is where remote debugging comes in.
The concept involves a debugger server running alongside your application code and a client (your IDE) connecting to it over a network. `debugpy` is a popular library for this, used by VS Code.
To enable this, you’d slightly modify your application’s entry point to start the `debugpy` listener.
# In your remote application (e.g., inside a Docker container)
import debugpy
import time

# 0.0.0.0 allows connections from any IP, crucial for Docker
# The port 5678 is a standard for this purpose
try:
    debugpy.listen(("0.0.0.0", 5678))
    print("Debugger is listening on port 5678. Waiting for client to attach...")
    # This call will block until a client attaches.
    debugpy.wait_for_client()
    print("Debugger attached!")
except Exception as e:
    print(f"Debugger could not start: {e}")

# Your actual application logic starts here
# You can now set breakpoints in your IDE and they will be hit
print("Application starting...")
for i in range(100):
    print(f"Processing step {i+1}...")
    # A breakpoint set on the next line in your IDE would now be triggered
    time.sleep(2)

print("Application finished.")
You would then configure your local IDE (e.g., VS Code’s `launch.json`) to “attach” to the remote machine’s IP address and port. Once connected, you can set breakpoints and inspect code as if it were running locally. This technique is a game-changer for debugging complex backend and microservices architectures.
Debugging in Web Frameworks like Django and Flask

Developer looking at code with errors – Does the volatile keyword work properly on global memory – CUDA …
Frameworks like Django and Flask come with their own debugging tools. The most famous is the “debug page,” which appears when an unhandled exception occurs while in debug mode. This page provides a full stack trace, local variable inspection for each frame, and other useful system information.
While incredibly useful, you can also combine these with interactive debuggers. For example, you can place a `pdb.set_trace()` inside a Django view or a Flask route handler to pause a web request and inspect the `request` object, database queries, or any other part of the process.
Best Practices for an Effective Debugging Workflow
Tools are only one part of the equation. A disciplined approach and a strategic mindset are essential for efficient bug fixing.
1. Reproduce the Bug Reliably
You cannot fix what you cannot trigger. The first step is always to find a consistent way to reproduce the error. This might involve identifying specific inputs, user actions, or system states. Write a failing unit test that codifies this scenario; this test will serve as your validation when you believe you’ve fixed the bug.
2. Understand the Stack Trace
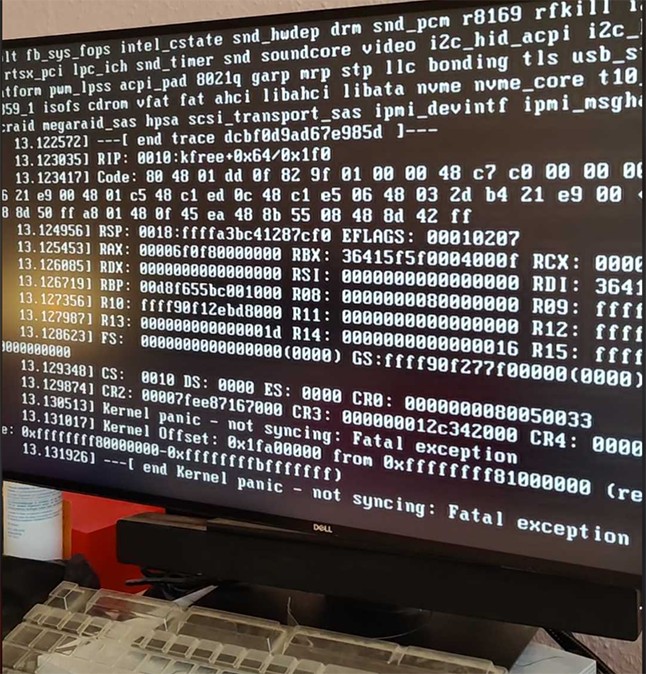
Don’t be intimidated by a long stack trace. It’s a map that tells you exactly how your program arrived at the error. Read it from the bottom up: the last line is the error itself, and each line above it is a step back in the call chain. This helps you pinpoint the exact location and context of the failure.

Developer looking at code with errors – Problems with AperturePhotometry | PixInsight Forum
3. Isolate the Problem
Use a “divide and conquer” strategy. If you have a large function or module, try to narrow down the problematic section. Comment out code blocks, return hardcoded values, or use a debugger to step through the logic until you find the precise area where the state becomes incorrect.
4. Embrace Test-Driven Development (TDD)
Writing tests before you write code forces you to think about edge cases and potential failure points upfront. A comprehensive test suite acts as a safety net, often catching bugs before they ever make it into your main application. When a bug does appear, writing a new test that reproduces it is the perfect first step toward a solution.
Conclusion: Debugging as a Skill
Debugging is more than just a chore; it’s a critical software development skill that deepens your understanding of the code and the systems you build. We’ve journeyed from the simplicity of the `logging` module to the interactive power of `pdb` and modern IDEs, and even touched on advanced remote debugging for complex applications.
The key takeaway is to move beyond `print()` and embrace the right tool for the job. Start by integrating the `logging` module into your projects for better diagnostics. Get comfortable with `pdb` or your IDE’s interactive debugger for hands-on inspection. As your needs evolve, explore the advanced capabilities of remote and framework-specific debugging.
By adopting these techniques and best practices, you can transform bug fixing from a frustrating bottleneck into a methodical and rewarding process of problem-solving, leading to more robust, reliable, and maintainable Python code.


