
In the world of monolithic applications, debugging was a relatively straightforward affair. A developer could attach a debugger, step through the code, and inspect the state of the entire system from a single vantage point. The trusty console.log() or print() statement, while crude, could often pinpoint an issue within a single, cohesive codebase. But in a microservices architecture, that simplicity evaporates. A single user request might trigger a cascade of calls across a dozen different services, each with its own state, logs, and potential points of failure. In this distributed world, relying on isolated console.log statements is like trying to navigate a labyrinth blindfolded. You see small, disconnected pieces of the puzzle, but the complete picture remains elusive.
This complexity demands a fundamental shift in our approach to software debugging. We must move from reactive, instance-specific debugging to proactive, system-wide observability. The goal is no longer just to find a bug but to understand the emergent behavior of a complex, distributed system. This guide will walk you through the principles, tools, and techniques required to build a robust debugging strategy for your microservices, transforming your debugging process from hours of frustrating guesswork into minutes of targeted analysis. We’ll explore how to leverage structured logging, distributed tracing, and a cohesive observability stack to bring clarity to the chaos of production debugging.
The Foundation: Rethinking Logging for Distributed Systems
The first step in taming a distributed system is to ensure that the data it emits is useful. Raw, unstructured log strings are easy to write but incredibly difficult to parse, query, and correlate at scale. The foundation of any modern debugging strategy is structured, machine-readable logging.
From console.log to Structured Logging
Structured logging involves writing logs in a consistent format, typically JSON, where data is organized into key-value pairs. This makes logs easy to ingest, index, and query by log aggregation platforms like Elasticsearch, Loki, or Datadog.
Consider a typical unstructured log in a Node.js application:
console.log(`Error processing order ${orderId} for user ${userId}: Payment failed.`);
Searching for all payment failures for a specific user requires complex text parsing. A structured log, however, captures this context explicitly:
{
  "level": "error",
  "timestamp": "2023-10-27T10:00:00.123Z",
  "message": "Payment failed",
  "service": "payment-service",
  "details": {
    "orderId": "ord_12345",
    "userId": "usr_abcde",
    "reason": "Insufficient funds"
  }
}
This format is instantly searchable. You can easily query for all logs where level="error" and service="payment-service". Libraries like Pino for Node.js or structlog for Python make generating these logs simple and performant. Most importantly, structured logs allow you to inject crucial context, like a Trace ID, which becomes the thread that ties everything together.
// Example of using Pino for structured logging in Node.js
const pino = require('pino');

// Create a logger instance. In a real app, you'd pass a traceId.
const logger = pino({
  level: 'info',
  base: {
    service: 'order-service',
    pid: process.pid,
  },
  timestamp: () => `,"time":"${new Date().toISOString()}"`,
});

function processOrder(order, traceId) {
  // Create a child logger with request-specific context
  const childLogger = logger.child({ traceId: traceId, orderId: order.id });

  childLogger.info('Starting order processing');

  try {
    // ... business logic ...
    if (!order.paymentDetails) {
      throw new Error('Missing payment details');
    }
    childLogger.info('Order processed successfully');
  } catch (error) {
    // Log the error with full context
    childLogger.error({ err: error }, 'Failed to process order');
  }
}

const sampleOrder = { id: 'ord-xyz-789', paymentDetails: null };
const sampleTraceId = 'trace-abc-123';

processOrder(sampleOrder, sampleTraceId);
In this example, every log message related to this specific order processing request will be tagged with the same traceId and orderId, making them easy to find and correlate later.
The Game Changer: Implementing Distributed Tracing
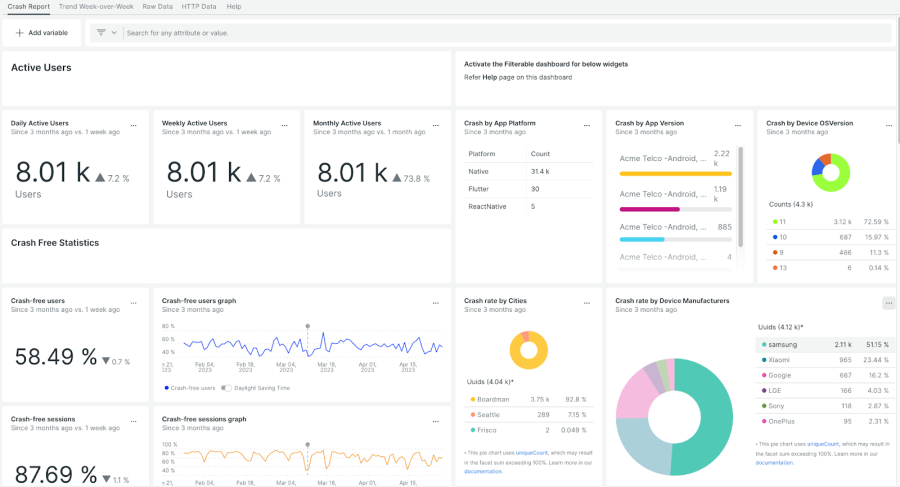
Observability dashboard – Mobile App Observability-Driven Dashboards | New Relic
While structured logging helps you find all the messages from a single request, distributed tracing shows you the journey of that request across multiple services. It visualizes the entire call graph, including timing, latency, and dependencies, making it the single most powerful tool for microservices debugging.
What is Distributed Tracing?
Distributed tracing models a request’s lifecycle as a Trace, which is a collection of Spans.
- Trace: Represents the entire end-to-end request journey, identified by a unique Trace ID.
- Span: Represents a single unit of work or operation within a service (e.g., an API call, a database query), identified by a Span ID. Each span within a trace shares the same Trace ID.
When a service calls another, it propagates the Trace ID (and its own Span ID as the Parent ID) in the request headers. The receiving service then creates a new child span, linking it back to the caller. This creates a complete, causal chain of events.
Practical Implementation with OpenTelemetry
OpenTelemetry (OTel) has emerged as the open-source, vendor-neutral standard for instrumenting applications to generate telemetry data (traces, metrics, and logs). It provides SDKs for most popular languages that can automatically instrument frameworks and libraries to create and propagate traces.
Here’s how you can set up basic tracing for a Node.js Express application. This code initializes the OTel SDK, automatically instruments the `express` and `http` modules, and exports the trace data to the console (in a real scenario, you’d export to a backend like Jaeger or Zipkin).
// tracing.js - This file should be imported before any other code in your app
const { NodeSDK } = require('@opentelemetry/sdk-node');
const { ConsoleSpanExporter } = require('@opentelemetry/sdk-trace-node');
const {
  getNodeAutoInstrumentations,
} = require('@opentelemetry/auto-instrumentations-node');
const {
  PeriodicExportingMetricReader,
  ConsoleMetricExporter,
} = require('@opentelemetry/sdk-metrics');

// Configure the SDK to export telemetry data
const sdk = new NodeSDK({
  // For demonstration, we export traces to the console.
  // In production, you would use an exporter for Jaeger, Zipkin, etc.
  // e.g., new OTLPTraceExporter()
  traceExporter: new ConsoleSpanExporter(),
  metricReader: new PeriodicExportingMetricReader({
    exporter: new ConsoleMetricExporter(),
  }),
  // Automatically instrument popular libraries like Express, HTTP, pg, etc.
  instrumentations: [getNodeAutoInstrumentations()],
});

// Start the SDK and gracefully shut it down on process exit
sdk.start();

process.on('SIGTERM', () => {
  sdk.shutdown()
    .then(() => console.log('Tracing terminated'))
    .catch((error) => console.log('Error terminating tracing', error))
    .finally(() => process.exit(0));
});
You would then start your application by pre-loading this file:
node -r ./tracing.js your-app.js
With this setup, any incoming HTTP request to your Express server will automatically start a new trace. When your service makes an outbound HTTP call to another microservice (that is also instrumented), OTel will automatically inject the necessary `traceparent` headers to continue the trace. This seamless context propagation is what makes API debugging and integration debugging in a distributed environment possible.
Advanced Techniques for Complex Scenarios
Once you have logging and tracing in place, you can tackle more complex and elusive bugs using advanced debugging techniques tailored for containerized and production environments.
Remote Debugging in Containers (Docker/Kubernetes)
Sometimes, a bug only reproduces in a specific environment. Remote debugging allows you to attach your local IDE’s debugger to a process running inside a Docker container or a Kubernetes pod. For Node.js, you can enable the inspector protocol by modifying your container’s start command.
Observability dashboard – How Salesforce’s Observability Platform Scales
Update your `Dockerfile` to expose the debug port and start the application with the `–inspect` flag:
# Dockerfile
FROM node:18-alpine

WORKDIR /usr/src/app

COPY package*.json ./
RUN npm install

COPY . .

# Expose the application port and the debug port
EXPOSE 3000
EXPOSE 9229

# Start Node.js with the inspector enabled, listening on all interfaces
CMD [ "node", "--inspect=0.0.0.0:9229", "server.js" ]
Then, in your `docker-compose.yml` or Kubernetes deployment, map the container’s debug port to your host machine. This allows tools like VS Code or Chrome DevTools to connect to the running process, letting you set breakpoints, inspect memory, and step through code as if it were running locally. This is invaluable for Docker debugging and Kubernetes debugging.
Proactive Debugging with Error Tracking Platforms
Error tracking platforms like Sentry, Bugsnag, or Rollbar go beyond simple logging. They automatically capture unhandled exceptions and crashes, group them into unique issues, and enrich them with valuable context like stack traces, request headers, user information, and even the “breadcrumbs” (user actions) that led to the error. This turns a cryptic error message into an actionable bug report, dramatically speeding up the bug fixing process.
Integrating Sentry into an Express app is straightforward:
const express = require('express');
const Sentry = require('@sentry/node');
const { ProfilingIntegration } = require("@sentry/profiling-node");

const app = express();

Sentry.init({
  dsn: 'YOUR_SENTRY_DSN_HERE',
  integrations: [
    // enable HTTP calls tracing
    new Sentry.Integrations.Http({ tracing: true }),
    // enable Express.js middleware tracing
    new Sentry.Integrations.Express({ app }),
    new ProfilingIntegration(),
  ],
  // Performance Monitoring
  tracesSampleRate: 1.0,
  profilesSampleRate: 1.0,
});

// The Sentry request handler must be the first middleware on the app
app.use(Sentry.Handlers.requestHandler());
// TracingHandler creates a trace for every incoming request
app.use(Sentry.Handlers.tracingHandler());

app.get('/', function rootHandler(req, res) {
  res.end('Hello world!');
});

// This route will intentionaly throw an error
app.get('/debug-sentry', function mainHandler(req, res) {
  throw new Error('My first Sentry error!');
});

// The Sentry error handler must be before any other error middleware and after all controllers
app.use(Sentry.Handlers.errorHandler());

app.listen(3000);
When the `/debug-sentry` endpoint is hit, Sentry will capture the error and present it in a detailed dashboard, providing far more context than a simple log line ever could.
Building a Cohesive Debugging Strategy and Best Practices

Observability dashboard – Observability as a Service: Transforming How Businesses Monitor …
Individual tools are powerful, but their true value is realized when integrated into a cohesive strategy. The goal is to create a unified view of your system’s health where you can seamlessly pivot between different types of telemetry data.
Unifying Your Observability Stack
A mature observability stack often consists of several specialized tools working together:
- Metrics (Prometheus): For high-level, aggregated data about system performance (CPU usage, request latency, error rates).
- Logging (Loki/Elasticsearch): For detailed, event-specific information.
- Tracing (Jaeger/Tempo): For understanding request flows and dependencies.
- Visualization (Grafana): A single pane of glass to build dashboards that display data from all the above sources.
The key to unifying these tools is correlation. By ensuring your logs, metrics, and traces all share common metadata—most importantly, the Trace ID—you can create powerful workflows. For example, you can click on a spike in a latency graph in Grafana and jump directly to the specific traces from that time period in Jaeger, then view the corresponding structured logs for one of those slow traces in Loki.
Debugging Best Practices
- Always Propagate Context: Ensure that a unique request/correlation ID (ideally a Trace ID) is generated at the edge of your system and propagated through every service call and logged in every message.
- Standardize Your Logs: Enforce a consistent, structured logging schema across all microservices. This makes cross-service queries possible.
- Embrace Health Checks: Use liveness and readiness probes (e.g., in Kubernetes) to automatically detect and restart unhealthy service instances before they cause cascading failures.
- Invest in Developer Experience: Make it easy for developers to access, query, and visualize observability data. A powerful tool that no one knows how to use is worthless.
- Combine Testing and Debugging: Use your observability stack during integration and end-to-end tests. Analyzing traces from failed tests can provide deep insights into integration issues.
Conclusion
Debugging microservices is a fundamentally different challenge than debugging a monolith. It requires a shift from the imperative “step-through” mindset to an investigative approach centered on system-wide observability. By abandoning the limitations of `console.log` and embracing the three pillars of observability—structured logs, distributed traces, and comprehensive metrics—you can transform your debugging process.
Start by implementing structured logging to make your application’s output meaningful and searchable. Next, integrate distributed tracing with a tool like OpenTelemetry to gain visibility into the complex interactions between your services. Finally, unify these data streams into a cohesive platform that allows you to correlate events and understand the holistic behavior of your system. This investment in a robust debugging and observability stack will pay for itself many times over, enabling your team to find and fix issues in minutes, not hours, and build more resilient, reliable, and understandable distributed systems.