In the intricate ecosystem of modern web development, the ability to effectively debug applications is arguably more valuable than the ability to write new code. As applications evolve from simple static pages to complex Single Page Applications (SPAs) and Progressive Web Apps (PWAs), the surface area for potential errors expands exponentially. Frontend Debugging is no longer just about inspecting HTML elements or tweaking CSS; it involves a holistic approach that traces data integrity from the user interface, through the network layer, and deep into the backend architecture.
The journey of a single data point—from a user’s keystroke in a React form to its final persistence in a database—is fraught with potential pitfalls. State mutations can go awry, API payloads can be malformed, and network latency can introduce race conditions. To master Software Debugging, developers must adopt a detective’s mindset, utilizing a combination of static analysis, dynamic analysis, and robust logging strategies. This comprehensive guide will explore the depths of Full Stack Debugging, providing you with the tools, techniques, and code examples necessary to tackle everything from JavaScript Errors to performance bottlenecks.
Section 1: The First Line of Defense – State and Component Logic
When a bug is reported—perhaps a button that doesn’t submit or a display that shows outdated information—the investigation almost always begins in the browser. However, relying solely on sporadic console.log statements is akin to finding a needle in a haystack with a flashlight. Effective React Debugging (or Vue/Angular Debugging) requires a systematic approach to state management.
Tracing Data Flow in Component State
In modern frameworks, the UI is a reflection of the state. If the UI is wrong, the state is wrong. The first step in tracing data is to verify what is actually stored in your component’s memory versus what you expect to be there. A common pitfall in JavaScript Development is the asynchronous nature of state updates. Developers often log a state variable immediately after setting it, only to see the old value, leading to confusion.
Below is an example of a common debugging scenario in a React form, demonstrating how to properly inspect state changes using the useEffect hook to trace the data lifecycle.
import React, { useState, useEffect } from 'react';
const UserRegistration = () => {
const [formData, setFormData] = useState({
username: '',
email: '',
role: 'user'
});
// DEBUGGING TIP:
// Do not log state immediately after setFormData.
// Use useEffect to log when the state actually updates.
useEffect(() => {
console.group('State Update Detected');
console.log('Current Form Data Snapshot:', formData);
console.log('Is Valid?', formData.username.length > 3);
console.groupEnd();
}, [formData]);
const handleChange = (e) => {
const { name, value } = e.target;
// Common Bug Source: Asynchronous updates
setFormData(prev => ({
...prev,
[name]: value
}));
};
const handleSubmit = () => {
// Critical Checkpoint: What are we actually sending?
console.info('Preparing to submit payload:', JSON.stringify(formData, null, 2));
// apiCall(formData)...
};
return (
);
};
export default UserRegistration;Leveraging Browser Developer Tools
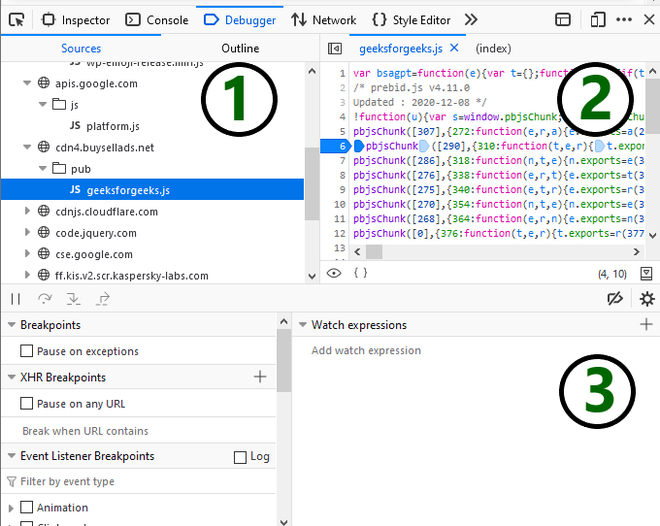
While logging is useful, Chrome DevTools offers a more powerful suite for Web Debugging. The “Sources” tab allows you to set breakpoints, which pauses code execution. This is superior to logging because it allows you to inspect the entire scope at that exact moment in time. You can hover over variables to see their values, check the Call Stack to see what function triggered the current execution, and step through code line-by-line.
For TypeScript Debugging, ensuring your source maps are correctly configured is critical. Source maps allow the browser to reconstruct the original TypeScript code from the compiled JavaScript, letting you debug the code you actually wrote rather than the minified bundle.
Section 2: The Network Layer – API and Request Debugging
Once the data leaves the frontend component, it enters the network layer. This is where API Debugging becomes paramount. A “frontend bug” is often actually a data mismatch between what the client sends and what the server expects. Is the frontend sending a string when the backend expects an integer? Is the authentication token missing from the headers?
Interceptors: The Global Watchdogs
Instead of adding logs to every single API call, a best practice in Full Stack Debugging is to utilize interceptors. Whether you are using Axios or the native Fetch API, you can configure your application to log every outgoing request and every incoming response. This creates a centralized stream of network activity, making it easy to spot 401 Unauthorized errors or 500 Server Errors.
Here is how you can implement a robust debugging interceptor using Axios. This setup helps in tracing the data from the moment it leaves the browser.
import axios from 'axios';

const apiClient = axios.create({
    baseURL: 'https://api.example.com',
    timeout: 5000,
});

// REQUEST INTERCEPTOR
// Captures the data just before it leaves the browser
apiClient.interceptors.request.use(
    (config) => {
        // Use console.table for cleaner object visualization
        console.group('🚀 API Request Initiated');
        console.log(`Method: ${config.method.toUpperCase()} | URL: ${config.url}`);
        console.log('Headers:', config.headers);

        if (config.data) {
            console.log('Payload (req.body):', config.data);
        }

        if (config.params) {
            console.log('Query Params:', config.params);
        }
        console.groupEnd();

        return config;
    },
    (error) => {
        console.error('❌ Request Construction Error:', error);
        return Promise.reject(error);
    }
);

// RESPONSE INTERCEPTOR
// Captures the data immediately as it returns from the backend
apiClient.interceptors.response.use(
    (response) => {
        console.group('✅ API Response Received');
        console.log(`Status: ${response.status} ${response.statusText}`);
        console.log('Data:', response.data);
        console.groupEnd();
        return response;
    },
    (error) => {
        console.group('⚠️ API Error Occurred');
        if (error.response) {
            // The request was made and the server responded with a status code
            // that falls out of the range of 2xx
            console.error('Status:', error.response.status);
            console.error('Server Data:', error.response.data);
        } else if (error.request) {
            // The request was made but no response was received
            console.error('No Response Received (Network Issue?)');
        } else {
            // Something happened in setting up the request that triggered an Error
            console.error('Error Message:', error.message);
        }
        console.groupEnd();
        return Promise.reject(error);
    }
);

export default apiClient;
Analyzing Network Traffic
Within the Network Debugging realm, the “Network” tab in developer tools is indispensable. When an API request fails, inspect the “Payload” tab to ensure the JSON structure matches the backend schema. Use the “Preview” tab to read the server’s response. A common trick for reproducing bugs is to right-click a failed request in the Network tab and select “Copy as cURL.” You can then paste this into your terminal or a tool like Postman to isolate the API call from the frontend UI logic.
Section 3: Backend Integration and Full Stack Tracing
Frontend debugging often bleeds into Backend Debugging. If the frontend sends the correct data but the application still fails, the issue likely resides in how the server processes that request. Tracing the execution path from the `req.body` entry point through the controller logic is essential.
Debugging the Receiver: Node.js and Python
In a Node.js Development environment, tools like `ndb` or the built-in VS Code debugger allow you to attach to the running process. However, for quick tracing of data flow, middleware logging is the server-side equivalent of the frontend interceptors we discussed earlier. This confirms exactly what the server received, ruling out any transformation issues caused by proxies, load balancers, or CORS configurations.
Below is a Node.js Express middleware example that logs incoming requests, completing the trace from the frontend form.
const express = require('express');
const app = express();

app.use(express.json());

// Middleware for Request Tracing
const requestLogger = (req, res, next) => {
    const timestamp = new Date().toISOString();
    console.log(`[${timestamp}] Incoming Request: ${req.method} ${req.url}`);

    // Critical for debugging: What did the parser make of the body?
    if (Object.keys(req.body).length > 0) {
        console.log('📦 Parsed Body:', JSON.stringify(req.body, null, 2));
    } else {
        console.log('⚠️ Empty Body received');
    }

    if (Object.keys(req.query).length > 0) {
        console.log('🔍 Query Params:', req.query);
    }

    next();
};

app.use(requestLogger);

app.post('/api/register', (req, res) => {
    // Simulate logic
    const { username } = req.body;
    if (!username) {
        console.error('❌ Validation Failed: Missing username');
        return res.status(400).json({ error: 'Username required' });
    }

    console.log('✅ Validation Passed. Saving user...');
    res.status(201).json({ message: 'User created', userId: 12345 });
});

app.listen(3000, () => console.log('Server running on port 3000'));
For those working with Python Debugging in frameworks like Django or Flask, the concept remains the same. You would utilize decorators or middleware to print `request.data` or `request.json` to the server logs. This end-to-end visibility—seeing the console log in the browser match the log in the server terminal—is the holy grail of Full Stack Debugging.
Section 4: Advanced Techniques and Production Debugging
Development environments are safe havens, but Production Debugging is where the real challenge lies. Users will encounter bugs that you cannot reproduce locally due to device differences, network speeds, or data states. This requires a shift from active debugging to passive monitoring and performance analysis.
Performance Profiling and Memory Leaks
Sometimes the “bug” isn’t a crash, but a freeze. Debug Performance issues by using the “Performance” tab in DevTools. You can record a session while interacting with the app to identify “Long Tasks” that block the main thread. Memory Debugging is equally critical; detached DOM nodes or uncleared intervals can cause memory leaks that crash the browser tab over time.
You can programmatically measure performance bottlenecks in your code using the Performance API. This is useful for identifying slow functions in complex calculations or rendering logic.
const heavyCalculation = (data) => {
    // Start the timer
    performance.mark('calc-start');

    // Simulate heavy work
    const result = data.map(item => Math.sqrt(item.value) * Math.random());

    // End the timer
    performance.mark('calc-end');

    // Measure the duration
    performance.measure('Calculation Duration', 'calc-start', 'calc-end');

    // Retrieve the measure
    const measure = performance.getEntriesByName('Calculation Duration')[0];
    console.log(`⏱️ Operation took ${measure.duration.toFixed(2)}ms`);

    // Cleanup
    performance.clearMarks();
    performance.clearMeasures();

    return result;
};
Error Boundaries and Remote Logging
In React, if a component crashes, it can bring down the entire application tree. Implementing Error Boundaries allows you to catch JavaScript errors anywhere in the child component tree, log those errors, and display a fallback UI. For Production Debugging, you should integrate Error Tracking services like Sentry or LogRocket. These tools capture the stack trace, the Redux state, and even a video replay of the user’s session leading up to the error.
Best Practices for Maintainable Debugging
To minimize the time spent fixing bugs, developers should adopt proactive strategies:
- Static Analysis: Use tools like ESLint and Prettier. They catch syntax errors and potential logic flaws before you even run the code.
- Unit Test Debugging: Write tests using Jest or Mocha. If a bug is found, write a test case that reproduces it, then fix the code until the test passes. This prevents regression.
- Clean Code: Break complex functions into smaller, pure functions. It is much easier to debug a 10-line function than a 500-line “god object.”
- Environment Parity: Use Docker Debugging to ensure your local environment matches production as closely as possible, reducing “it works on my machine” issues.
Conclusion
Frontend Debugging is a discipline that extends far beyond the browser console. It requires a comprehensive understanding of how data flows through an application, from the initial state change in a UI component to the final processing in the backend API. By mastering tools like Chrome DevTools, implementing robust logging via interceptors, and utilizing performance profiling APIs, developers can transform debugging from a frustrating guessing game into a precise scientific process.
As you continue your journey in Web Development, remember that every error message is a clue, and every bug is an opportunity to understand your system better. Whether you are performing Mobile Debugging on a remote device or analyzing stack traces in a Microservices architecture, the principles remain the same: isolate variables, trace the data, and verify assumptions. Start implementing these strategies today to build more resilient, high-quality software.

