Introduction
In the rapidly evolving landscape of web development, the browser has transformed from a simple document viewer into a sophisticated operating system for applications. As modern web applications grow in complexity—leveraging intricate JavaScript frameworks, real-time data streaming, and heavy client-side computation—the art of Browser Debugging has become the most critical skill in a developer’s arsenal. Whether you are engaged in Frontend Debugging with React or Vue, or troubleshooting Full Stack Debugging scenarios involving complex API interactions, the ability to dissect and diagnose issues within the browser environment is paramount.
Gone are the days when Web Development Tools were limited to viewing source code. Today, suites like Chrome DevTools, Firefox Developer Tools, and Safari Web Inspector offer an Integrated Development Environment (IDE) experience directly within the browser. These tools facilitate everything from Network Debugging and Memory Debugging to sophisticated Performance Monitoring. However, many developers only scratch the surface, relying heavily on basic logging rather than utilizing the full power of Debug Tools available to them. This comprehensive guide explores the depths of browser debugging, moving from core concepts to advanced techniques, ensuring you can handle JavaScript Errors, optimize rendering, and master Application Debugging with confidence.
Section 1: Core Concepts and The Evolution of the Console
At the heart of JavaScript Debugging lies the Console. While it is the first tool most developers reach for, it is often underutilized. Effective Code Debugging starts with understanding that the console is not just a text output stream; it is a REPL (Read-Eval-Print Loop) environment that interacts directly with the window object and the DOM.
Beyond Console.log
While console.log is ubiquitous, it can clutter your output and make Error Tracking difficult. Modern browsers support a variety of methods that provide semantic meaning to your logs. Using console.warn and console.error not only colors the output differently but also provides a stack trace in many browsers, which is essential for Bug Fixing in large codebases.
Furthermore, when dealing with large datasets or arrays of objects—common in API Development—formatting is key. The console.table method visualizes data in a structured format, making it easier to spot anomalies in data returned from a Node.js or Python backend.
// Advanced Console Techniques for Better Data Visualization

const users = [
    { id: 1, name: "Alice", role: "Admin", status: "Active" },
    { id: 2, name: "Bob", role: "User", status: "Inactive" },
    { id: 3, name: "Charlie", role: "User", status: "Active" }
];

// Instead of a raw object dump
console.log("Raw Users:", users);

// Use table for structured data debugging
console.table(users);

// Grouping logs to declutter the console
console.group("User Processing Transaction");
console.time("ProcessTime");

try {
    users.forEach(user => {
        if (user.status === "Inactive") {
            console.warn(`Skipping inactive user: ${user.name}`);
        } else {
            console.log(`Processing ${user.name}...`);
        }
    });
} catch (error) {
    console.error("Critical failure in processing loop", error);
}

console.timeEnd("ProcessTime");
console.groupEnd();
Understanding Stack Traces
When an error occurs, the browser generates a Stack Trace. This is a snapshot of the call stack at the moment the exception was thrown. In TypeScript Debugging or when using transpilers (Babel), reading stack traces can be challenging because the code running in the browser is different from your source code. This is where Source Maps come into play. Source maps map the minified code back to your original source, allowing you to debug React Debugging or Vue Debugging sessions as if you were running the raw code.
Section 2: Implementation Details – Breakpoints and Flow Control
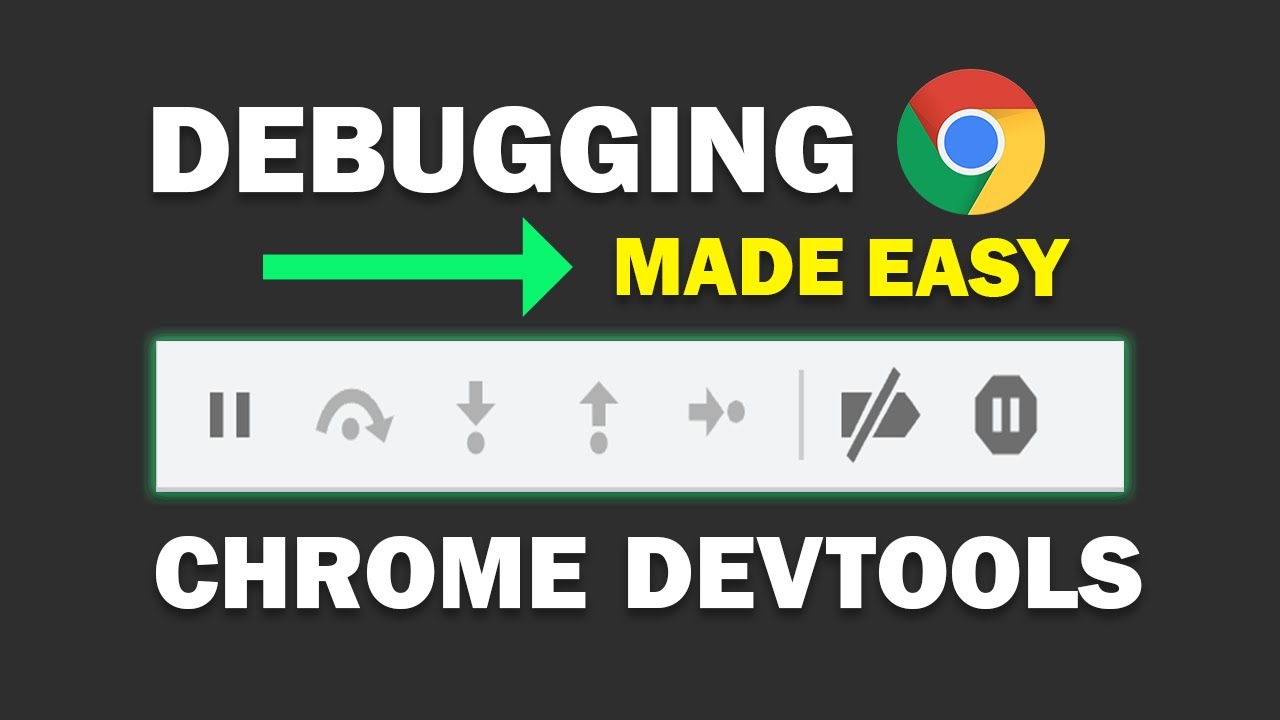
While console logging is useful for monitoring state, it is passive. Active Software Debugging requires halting execution to inspect the application state at a specific moment. This is achieved through breakpoints.
The Power of the ‘debugger’ Statement

The most direct way to pause execution is the debugger; statement. When the browser’s developer tools are open, the JavaScript engine will pause execution exactly at this line. This is incredibly useful for Unit Test Debugging or when you want to isolate a specific logic flow without manually clicking line numbers in the Sources panel.
// utilizing the debugger statement for logic isolation

function calculateCartTotal(items, taxRate) {
    let subtotal = 0;

    // Logic to calculate subtotal
    items.forEach(item => {
        subtotal += item.price * item.quantity;
    });

    // Conditional breakpoint logic inside code
    if (subtotal > 1000) {
        // Execution will pause here ONLY if subtotal exceeds 1000
        // This helps in debugging specific edge cases
        debugger;
    }

    const tax = subtotal * taxRate;
    const total = subtotal + tax;

    return { subtotal, tax, total };
}

const cartItems = [
    { name: "Laptop", price: 900, quantity: 1 },
    { name: "Mouse", price: 50, quantity: 2 }
];

const finalBill = calculateCartTotal(cartItems, 0.08);
console.log(finalBill);
Conditional and DOM Breakpoints
In complex Single Page Applications (SPAs), code often runs repeatedly (e.g., inside a render loop or event listener). A standard breakpoint would pause execution too frequently to be useful. Chrome DevTools allows for “Conditional Breakpoints,” where you right-click a line number and add an expression (e.g., id === 505). The code pauses only when that condition is true.
Additionally, DOM Breakpoints are vital for UI Debugging. If a DOM element is disappearing or changing attributes unexpectedly—perhaps due to a conflict between jQuery and React—you can right-click the element in the “Elements” panel and select “Break on… > Attribute modifications” or “Node removal.” This immediately takes you to the line of JavaScript responsible for the DOM manipulation.
Debugging Asynchronous Code
Async Debugging has historically been difficult because the call stack is lost when a callback executes. However, modern browsers support “Async Stack Traces.” When debugging Node.js Errors reflected in the frontend or complex async/await patterns, the browser can reconstruct the chain of promises, allowing you to see the function that initiated the asynchronous call.
Section 3: Advanced Techniques – Network, Performance, and Remote Debugging
Once logic errors are resolved, developers must focus on System Debugging—how the application interacts with the network and utilizes resources.
Network Debugging and API Inspection
The Network panel is the hub for API Debugging. Here, you can inspect XHR and Fetch requests, view headers, payloads, and response data. A common issue in Full Stack Debugging is CORS (Cross-Origin Resource Sharing) errors or incorrect content types sent from frameworks like Express, Django, or Flask.
You can also simulate network conditions. By throttling the network to “Slow 3G,” you can debug race conditions and loading states, ensuring your Error Monitoring logic handles timeouts gracefully.
// Robust Fetch Wrapper for API Debugging and Error Handling

async function fetchData(url) {
    try {
        const response = await fetch(url);

        // Debugging 4xx and 5xx errors which don't reject the promise automatically
        if (!response.ok) {
            const errorData = await response.json();

            // Custom error object for better stack tracing
            const apiError = new Error(`API Error: ${response.status} ${response.statusText}`);
            apiError.details = errorData;
            apiError.endpoint = url;

            throw apiError;
        }

        return await response.json();

    } catch (error) {
        // Differentiate between network failures and API errors
        if (error.name === 'TypeError' && error.message === 'Failed to fetch') {
            console.error("Network Debugging: Connection refused or CORS error.");
        } else {
            console.error("Application Debugging:", error);
            // Log to external error tracking service (e.g., Sentry)
        }
        return null;
    }
}

// Usage
fetchData('https://api.example.com/v1/data');
Performance Profiling and Memory Leaks
Performance Monitoring is distinct from functional debugging. The “Performance” tab records a timeline of activity, showing scripting time, rendering time, and painting time. This is crucial for identifying “jank” (stuttering animations) or long-running tasks that block the main thread.
Memory Debugging is equally critical, especially for long-lived applications. Memory leaks occur when objects are referenced but no longer needed (e.g., detached DOM nodes or uncleared intervals). Using the “Memory” tab to take Heap Snapshots allows you to compare memory usage over time and identify objects that are not being garbage collected.
![AI chatbot user interface - 7 Best Chatbot UI Design Examples for Website [+ Templates]](https://debuglab.net/wp-content/uploads/2025/12/inline_608826d0.jpg)
Remote Debugging on Mobile
Mobile Debugging is often neglected until late in the development cycle. Mobile browsers behave differently regarding touch events and viewport rendering. Remote Debugging allows you to connect an Android device via USB to your development machine and inspect the mobile Chrome instance using your desktop DevTools. This provides a pixel-perfect debugging environment for Responsive Design and mobile-specific JavaScript errors.
Section 4: Best Practices and Optimization Strategies
Mastering the tools is only half the battle; adopting a systematic approach to Debugging Best Practices is what distinguishes senior developers.
1. Isolate the Variable
When facing a complex bug, use the scientific method. Isolate the specific component or function causing the issue. If you are doing React Debugging, use the React Developer Tools profiler to see exactly which components are re-rendering unnecessarily. If it is a backend issue, use tools like Postman to verify the API independently of the browser code.
2. Static Analysis vs. Dynamic Analysis
Don’t rely solely on runtime debugging. Implement Static Analysis tools like ESLint and TypeScript. These tools catch syntax errors, type mismatches, and potential bugs before the code even runs in the browser. Dynamic Analysis (debugging) should be reserved for logic errors and runtime states that static tools cannot predict.
![AI chatbot user interface - 7 Best Chatbot UI Design Examples for Website [+ Templates]](https://debuglab.net/wp-content/uploads/2025/12/inline_21806071-scaled.jpg)
3. Backend Integration Debugging
In a Microservices Debugging context, the error might not originate in the browser. The browser might receive a generic “500 Internal Server Error.” To effectively debug this, you must correlate frontend logs with backend logs. Below is an example of how a Python backend might structure error responses to aid the frontend developer.
# Python (Flask) example: Structured Error Responses for Frontend Debugging

from flask import Flask, jsonify
import traceback

app = Flask(__name__)

@app.errorhandler(500)
def handle_internal_error(e):
    # Capture the stack trace for the response (only in dev mode!)
    tb = traceback.format_exc()

    response = {
        "error": "Internal Server Error",
        "message": str(e),
        "debug_trace": tb, # Critical for Full Stack Debugging
        "suggestion": "Check database connection string or query syntax."
    }
    return jsonify(response), 500

@app.route('/api/risky-operation')
def risky():
    # Simulate a division by zero error
    result = 1 / 0
    return jsonify({"result": result})

# When the frontend calls this, the JSON response contains
# the Python stack trace, allowing the frontend dev to
# understand WHY the 500 error occurred without leaving the browser.
4. Automate Debugging Workflows
Integrate Testing and Debugging into your CI/CD pipeline. Automated End-to-End (E2E) tests using tools like Cypress or Playwright can capture screenshots and video recordings of failures. This is essentially Debug Automation, allowing you to see exactly what happened in the browser during a failed test run in a headless environment like Docker or Kubernetes.
Conclusion
Browser debugging is a discipline that bridges the gap between code creation and user experience. It requires a deep understanding of the browser’s internal mechanics, from the event loop to the rendering pipeline. By moving beyond simple console logs and embracing the full suite of Developer Tools—including breakpoints, network analysis, and performance profiling—you can solve problems faster and build more robust applications.
As the industry moves toward more agentic development workflows and AI-assisted coding, the fundamental ability to inspect, diagnose, and understand the runtime environment remains irreplaceable. Whether you are performing Angular Debugging, optimizing a Node.js backend, or ensuring Mobile Debugging compliance, the techniques outlined in this guide provide the foundation for excellence in modern software engineering. Start using these tools today to transform your debugging process from a guessing game into a precise science.


