The Silent Guardian: Unlocking Code Quality with Static Analysis
In the fast-paced world of software development, the pressure to ship features quickly can often lead to technical debt, hidden bugs, and security vulnerabilities. While traditional testing and debugging are crucial, they are reactive by nature—they find problems after they have been introduced. What if you could catch entire classes of errors before the code is even run? This is the power of static analysis, a foundational practice for modern development that acts as a silent guardian for your codebase. By automatically inspecting code against a set of predefined rules, it provides an automated, scalable first line of defense, enhancing everything from Code Debugging to security hardening.
Static analysis is not just about enforcing style guides; it’s a powerful form of Code Analysis that identifies potential bugs, complex logic, and security flaws early in the development lifecycle. This “shift-left” approach saves invaluable time and resources, preventing issues from ever reaching production. This article dives deep into the world of static analysis, exploring its core concepts, practical implementation in CI/CD pipelines, advanced techniques, and best practices for integrating it seamlessly into your team’s workflow.
Section 1: Understanding the Core Concepts of Static Analysis
At its heart, static analysis is the process of analyzing source code without executing it. Unlike Dynamic Analysis, which observes a program’s behavior during runtime, static analysis examines the code’s structure, syntax, and data flow to predict potential issues. This process is typically automated by tools known as static analyzers or “linters.”
How Does It Work?
Most static analysis tools follow a similar high-level process:
- Parsing: The tool first parses the source code to build an internal representation, most commonly an Abstract Syntax Tree (AST). The AST is a tree-like structure that represents the grammatical structure of the code, making it easier to analyze programmatically.
- Building Models: For more advanced analysis, the tool might build additional models like a Control Flow Graph (CFG) to map all possible execution paths or a Data Flow Graph (DFG) to track how data moves through the application.
- Rule Checking: The tool then traverses these data structures, applying a pre-configured set of rules. These rules can range from simple style checks (e.g., line length) to complex security vulnerability detection (e.g., taint analysis for SQL injection).
- Reporting: Finally, any violations are reported back to the developer, often with file names, line numbers, and a description of the problem.
What Can Static Analysis Find?
Static analysis tools are incredibly versatile and can be configured to find a wide array of issues, including:
- Programming Errors: Null pointer dereferences, resource leaks, race conditions, and using uninitialized variables.
- Security Vulnerabilities: SQL injection, Cross-Site Scripting (XSS), buffer overflows, and insecure use of cryptographic APIs. This is a critical aspect of API Debugging and security.
- Code Smells: overly complex methods, duplicated code, and other violations of software design principles that indicate deeper problems.
- Style Violations: Inconsistent naming conventions, improper formatting, and other deviations from a team’s coding standard.
Consider this common pitfall in Python development: using a mutable default argument. This can lead to unexpected behavior that is difficult to debug.
def add_to_list(item, my_list=[]):
    """
    This function has a bug! The default list is created only once
    and shared across all calls that don't provide a list.
    """
    my_list.append(item)
    return my_list

# First call works as expected
list1 = add_to_list(1)
print(f"List 1: {list1}")  # Expected: [1], Actual: [1]

# Second call has a surprising side effect
list2 = add_to_list(2)
print(f"List 2: {list2}")  # Expected: [2], Actual: [1, 2]

# The original list is also affected
print(f"List 1 after second call: {list1}") # Actual: [1, 2]
A static analysis tool like Pylint or Flake8 would immediately flag this with a warning like W0102: dangerous-default-value. This proactive feedback prevents a tricky runtime bug, showcasing the power of static analysis as one of the most effective Debugging Techniques.
Section 2: Integrating Static Analysis into Your Workflow
To be effective, static analysis must be an integral part of the development process, not an afterthought. Modern Developer Tools make this integration easier than ever, from local IDEs to cloud-based CI/CD pipelines.

Code security vulnerability scan – AI Introduces Security Vulnerabilities Within Code in 45% of Cases …
Choosing the Right Tools
The right tool often depends on your technology stack. Here are some popular choices:
- JavaScript/TypeScript: ESLint is the de facto standard for identifying and reporting on patterns in JavaScript. It is highly extensible and can be configured for frameworks like React (
eslint-plugin-react) and Vue. - Python: Pylint, Flake8, and MyPy (for type checking) are staples in Python Development. They check for errors, enforce coding standards, and look for code smells.
- Java: Checkstyle, PMD, and SpotBugs are widely used. For comprehensive analysis, platforms like SonarQube offer deep integration and historical tracking.
- Multi-language Platforms: Tools like SonarQube, CodeQL (from GitHub), and Snyk provide robust analysis across dozens of languages, often with a focus on security.
IDE and Pre-Commit Hook Integration
The earliest feedback loop is in the developer’s editor. Most static analysis tools have plugins for popular IDEs like VS Code, JetBrains IDEs, and Sublime Text. These plugins provide real-time feedback, highlighting issues as you type.
For JavaScript projects, a typical ESLint configuration file (.eslintrc.js) might look like this:
module.exports = {
  env: {
    browser: true,
    es2021: true,
    node: true,
  },
  extends: [
    'eslint:recommended',
    'plugin:react/recommended',
    'plugin:prettier/recommended', // Integrates Prettier for formatting
  ],
  parserOptions: {
    ecmaFeatures: {
      jsx: true,
    },
    ecmaVersion: 12,
    sourceType: 'module',
  },
  plugins: ['react'],
  rules: {
    'no-console': 'warn', // Warn about console.log statements
    'react/prop-types': 'off', // Turn off prop-types for modern React with TypeScript
    'no-unused-vars': ['warn', { args: 'none' }], // Warn about unused variables
  },
  settings: {
    react: {
      version: 'detect', // Automatically detect the React version
    },
  },
};
Automating with CI/CD Pipelines
The most critical integration point is the CI/CD pipeline. By running static analysis on every commit or pull request, you create a quality gate that prevents problematic code from being merged. This is a cornerstone of CI/CD Debugging.
Here is an example of a GitHub Actions workflow that runs a linter on a Node.js project:
name: Lint Codebase

on:
  push:
    branches: [ main ]
  pull_request:
    branches: [ main ]

jobs:
  lint:
    name: Run ESLint
    runs-on: ubuntu-latest

    steps:
      - name: Checkout code
        uses: actions/checkout@v3

      - name: Set up Node.js
        uses: actions/setup-node@v3
        with:
          node-version: '18'
          cache: 'npm'

      - name: Install dependencies
        run: npm ci

      - name: Run linter
        run: npm run lint # Assumes a "lint" script is defined in package.json
This simple workflow ensures that every contribution is automatically checked, maintaining code quality and consistency across the team without manual intervention.
Section 3: Advanced Static Analysis Techniques
While basic linting is powerful, modern static analysis goes much deeper, employing sophisticated techniques to find complex bugs and security vulnerabilities.
Taint Analysis for Security
Taint analysis, also known as taint checking, is a form of data flow analysis used to track untrusted user input (the “taint”) through an application. If this tainted data reaches a sensitive function (a “sink”), such as a database query or a command execution, without being properly sanitized, the tool flags a potential vulnerability. This is extremely effective for finding injection-style attacks.
Consider this simplified Java servlet code, which is vulnerable to SQL injection:

Code security vulnerability scan – Integrating AWS CloudFormation security tests with AWS Security …
import java.sql.Connection;
import java.sql.Statement;
import javax.servlet.http.HttpServletRequest;

public class UserSearchServlet {
    public void searchUser(HttpServletRequest request, Connection connection) throws Exception {
        // Source: User input from an HTTP request is considered "tainted"
        String userId = request.getParameter("userId");

        // The tainted data flows directly into the SQL query
        String query = "SELECT * FROM users WHERE id = '" + userId + "'";

        // Sink: The database execution function receives the tainted query
        Statement statement = connection.createStatement();
        statement.executeQuery(query); // Vulnerability!
    }
}
An advanced static analysis security testing (SAST) tool would identify that userId is tainted data from an external source. It would then trace its path to the executeQuery sink and flag this line as a critical SQL injection vulnerability, a key part of robust Backend Debugging and security.
The Next Frontier: AI-Synthesized Checkers
The landscape of static analysis is evolving rapidly with the advent of AI and Large Language Models (LLMs). Traditional tools rely on manually written rules, which can be slow to develop and may not capture the nuances of project-specific bug patterns. A new paradigm is emerging where LLMs are leveraged to automatically synthesize new, specialized static analyzers.
The process works by training a model on a vast corpus of historical code changes, particularly bug fixes. The model learns to identify the patterns that distinguish buggy code from its patched version. It can then generate a highly specific checker programmatically to find similar patterns elsewhere in the codebase. This approach offers several advantages:
- Scalability: Automatically generates checkers for new bug patterns without manual effort.
– Traceability: Each finding can be traced back to the specific historical bug patterns it was derived from, making it easier to understand and trust the results.
– Customization: The generated checkers are tailored to the specific anti-patterns and conventions of a given project or ecosystem.
This evolution transforms static analysis from a system based on generic rules to a learning system that continuously adapts and improves, promising a new level of precision and scalability in Bug Fixing and prevention.
Section 4: Best Practices and Overcoming Common Pitfalls
Integrating static analysis is not without its challenges. To maximize its benefits and ensure team adoption, follow these best practices.
Tame the Noise: Managing False Positives
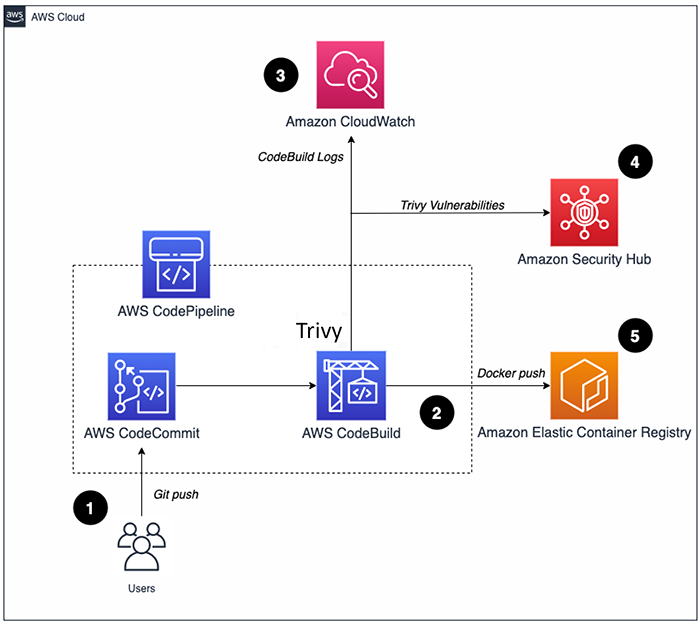
Code security vulnerability scan – How to build a CI/CD pipeline for container vulnerability scanning …
The most common complaint about static analysis is the high number of false positives—warnings that are not actual issues. This “alert fatigue” can cause developers to ignore all warnings, defeating the purpose of the tool.
- Start Small: When introducing a tool to a legacy codebase, enable only a small set of high-confidence, high-impact rules first (e.g., security vulnerabilities, critical bugs).
- Tune Your Ruleset: Regularly review and customize your configuration. Disable rules that are not relevant to your project or that produce too much noise.
- Use Suppression: Most tools allow you to suppress a specific warning on a line of code with a comment (e.g.,
// eslint-disable-next-line). Use this judiciously for known exceptions, and always include a comment explaining why the rule is being suppressed.
Make It Part of the Culture, Not a Blocker
Static analysis should be a helpful guide, not a punitive gatekeeper. Frame it as a tool for learning and improving, not just for catching mistakes. Celebrate the bugs it prevents and use its findings as talking points in code reviews. When the CI build fails due to a linting error, the goal should be to understand the underlying issue, not just to make the build pass.
Balance Speed and Thoroughness
Deep Code Analysis can be time-consuming. A full-system scan might take minutes or even hours on a large project, which is too slow for a pull request check. A good strategy is to use a tiered approach:
- On Pull Requests: Run a fast, incremental scan that only analyzes the changed files with a critical subset of rules.
- On Main Branch Merges / Nightly Builds: Run a deep, comprehensive scan of the entire codebase. This can catch more complex, inter-procedural issues without slowing down the daily development workflow.
Conclusion: Building a Foundation of Quality
Static analysis is an indispensable practice in modern software engineering. By automating the detection of bugs, security vulnerabilities, and code quality issues, it provides a powerful, proactive layer of defense. It empowers developers with immediate feedback, fosters a culture of quality, and ultimately leads to more robust, secure, and maintainable software. From simple linters integrated into an IDE to advanced, AI-driven security scanners in a CI/CD Debugging pipeline, these tools are fundamental to any high-performing development team.
If you haven’t already, the next step is clear: choose a static analysis tool appropriate for your stack, integrate it into your local environment and CI pipeline, and begin the journey of tuning it to fit your team’s needs. By embracing static analysis, you are not just fixing bugs; you are building a foundation of quality that will pay dividends throughout the entire lifecycle of your project.