The Art and Science of Frontend Debugging
In the intricate world of modern web development, writing code is only half the battle. The other half—often more challenging and time-consuming—is finding and fixing the inevitable bugs that arise. Frontend debugging is a critical skill that separates novice developers from seasoned professionals. It’s a systematic process of identifying, diagnosing, and resolving errors in the user-facing part of an application. As web applications grow in complexity with sophisticated frameworks, state management libraries, and asynchronous operations, a robust debugging strategy is no longer a luxury but a necessity. Effective web debugging not only accelerates development cycles but also significantly improves the quality and reliability of the final product. This guide provides a comprehensive overview of essential frontend debugging techniques, from foundational browser tools to advanced strategies for tackling complex issues in production environments. By mastering these tools and methodologies, you can transform frustrating bug hunts into efficient, insightful problem-solving sessions.
The Foundation: Mastering Browser Developer Tools
Every modern web browser comes equipped with a powerful suite of developer tools, which are the first and most important line of defense in any frontend debugging effort. While many developers are familiar with console.log(), these tools offer a much deeper level of introspection into your application’s behavior. Understanding their core features is fundamental to efficient code debugging.
The Console: Your Interactive JavaScript Command Center
The Console is far more than a simple log output. It’s an interactive environment for executing JavaScript, inspecting variables, and diagnosing runtime errors. While console.log() is a workhorse, leveraging more advanced console methods can provide clearer, more organized output.
console.table(): Renders arrays and objects in a clean, sortable table format, which is invaluable for inspecting complex data structures.console.group()andconsole.groupEnd(): Creates collapsible, indented groups of log messages to organize output from different parts of your application.console.warn()andconsole.error(): Differentiates messages by severity, making it easier to spot critical issues in a sea of logs. They also provide a full stack trace.
Consider this example for organizing debug output for a user data fetch:
function fetchAndProcessUserData(userId) {
  console.group(`Processing user: ${userId}`);
  console.log('Starting data fetch...');

  fetch(`https://api.example.com/users/${userId}`)
    .then(response => {
      if (!response.ok) {
        console.error('API request failed!', response.status);
        throw new Error('Network response was not ok.');
      }
      return response.json();
    })
    .then(data => {
      console.log('User data received:');
      const permissions = [
        { role: 'admin', access: 'full' },
        { role: 'editor', access: 'partial' }
      ];
      console.table(permissions); // Display permissions in a clean table
    })
    .catch(error => {
      console.warn('An error occurred during fetch:', error);
    })
    .finally(() => {
      console.log('Finished processing user data.');
      console.groupEnd();
    });
}

fetchAndProcessUserData(123);
The Debugger: Pausing and Inspecting Execution
The Sources (Chrome) or Debugger (Firefox) panel is where true JavaScript debugging happens. It allows you to pause code execution at any point and inspect the state of your application. The key feature here is the breakpoint. By setting a breakpoint on a line of code, you instruct the browser to pause before that line is executed. Once paused, you can:
- Inspect the Call Stack: See the chain of function calls that led to the current point.
- Examine Scope: View the values of all local, closure, and global variables at that exact moment.
- Step Through Code: Execute your code line-by-line (step over), jump into a function call (step into), or jump out of the current function (step out).
- Set Conditional Breakpoints: Configure a breakpoint to pause only when a specific condition is met (e.g.,
user.id === 42), which is essential for debugging loops or event handlers.
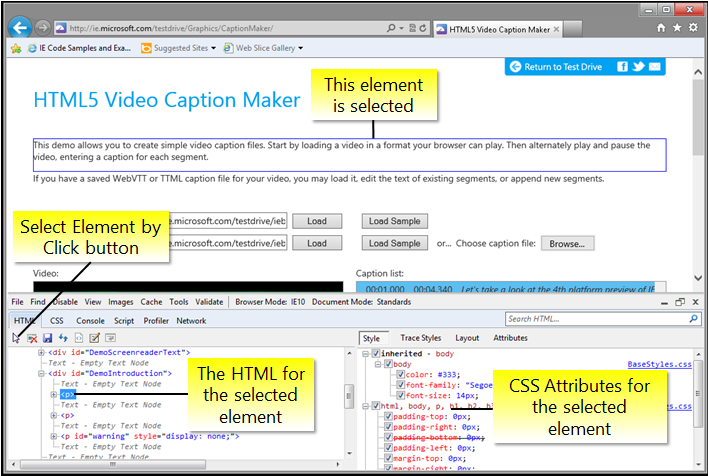
The Elements Panel: Real-time DOM and CSS Manipulation
Visual bugs are often rooted in the HTML structure (DOM) or CSS styles. The Elements (Chrome) or Inspector (Firefox) panel provides a live, editable view of the DOM tree and the CSS rules applied to each element. You can add, remove, or modify attributes and styles on the fly to test changes without reloading the page. Modern developer tools also include specialized inspectors for complex layouts. For instance, Firefox’s CSS Grid and Flexbox inspectors are exceptionally powerful, providing visual overlays and detailed information that make debugging responsive designs much easier.
Digging Deeper: Network, Performance, and State Debugging
Many frontend bugs are not isolated to a single script but are related to network communication, application performance, or complex state management. Advanced debugging requires looking beyond the console and sources panels to understand the entire application lifecycle.
Network Debugging for APIs and Assets
The Network panel is your window into every HTTP request your application makes. It’s indispensable for API debugging and optimizing asset loading. For any selected request, you can inspect:
- Headers: Check authentication tokens, content types, and caching policies.
- Payload: Verify the data being sent in POST or PUT requests.
- Response: Examine the JSON or other data returned from the server.
- Timing: Analyze how long each phase of the request took, from DNS lookup to content download.
When debugging a failing API call, the Network panel is the first place to look. A 401 Unauthorized status code points to an authentication issue, a 404 Not Found indicates a URL problem, and a 500 Internal Server Error signals a backend bug. This makes it a crucial tool for full-stack debugging.
async function postUserData(userData) {
  try {
    const response = await fetch('https://api.example.com/users', {
      method: 'POST',
      headers: {
        'Content-Type': 'application/json',
        'Authorization': 'Bearer YOUR_INVALID_TOKEN' // Intentionally invalid
      },
      body: JSON.stringify(userData)
    });

    if (!response.ok) {
      // The Network tab will show a 401 or 403 status for this request.
      // You can inspect the response body for an error message from the API.
      console.error(`API Error: ${response.status} ${response.statusText}`);
      const errorData = await response.json();
      console.log('Server error details:', errorData);
      return;
    }

    const result = await response.json();
    console.log('User created:', result);
  } catch (error) {
    console.error('Failed to post user data:', error);
  }
}

postUserData({ name: 'Jane Doe', email: '[email protected]' });
Framework-Specific Tooling: React, Vue, and Angular
Modern JavaScript frameworks like React, Vue, and Angular introduce layers of abstraction that can make standard debugging difficult. Fortunately, each has a dedicated browser extension that integrates with the developer tools.
- React Developer Tools: Allows you to inspect the component hierarchy, view and edit component props and state, and profile component rendering performance to identify bottlenecks. This is essential for any React debugging task.
- Vue.js devtools: Provides similar capabilities for Vue applications, including inspection of components, Vuex state, and routing information.
- Angular DevTools: Helps you visualize the component structure and inspect the state of your directives and components.
These tools are non-negotiable for anyone working with these frameworks, as they provide context-aware debugging that aligns with the framework’s architecture.
Advanced Frontend Debugging Techniques
Some bugs are particularly elusive, manifesting only under specific conditions or in complex parts of the application like asynchronous flows or long-running sessions. Tackling these requires more advanced techniques.
Async Debugging and Promises
Debugging asynchronous code used to be a nightmare of fragmented call stacks. Modern developer tools have vastly improved their support for async debugging. They now stitch together stack traces across asynchronous boundaries (like .then() or await), allowing you to see the full causal chain of events. You can place breakpoints inside async functions, promises, and event listeners just like you would with synchronous code and step through them logically.
function getUser(id) {
  return fetch(`https://api.example.com/users/${id}`)
    .then(res => res.json());
}

function getPosts(userId) {
  return fetch(`https://api.example.com/posts?userId=${userId}`)
    .then(res => res.json());
}

async function getUserAndPosts(id) {
  try {
    // Set a breakpoint on the next line to inspect the 'user' object
    const user = await getUser(id);

    // Set another breakpoint here to inspect both 'user' and 'posts'
    const posts = await getPosts(user.id);

    console.log(`${user.name} has ${posts.length} posts.`);
  } catch (error) {
    // A breakpoint here will catch any errors from either fetch call
    console.error("Failed to get user and posts:", error);
  }
}

getUserAndPosts(1);
By placing breakpoints on the lines with await, you can pause execution after each promise resolves and inspect the returned data before the next operation begins.
Memory Debugging to Hunt Down Leaks
A memory leak occurs when an application allocates memory but fails to release it when it’s no longer needed, causing performance to degrade over time and eventually crash the page. The Memory panel in browser dev tools helps you diagnose these issues. The primary technique is to take heap snapshots. You can take a snapshot, perform an action in your app that you suspect is causing a leak (like opening and closing a modal repeatedly), and then take another snapshot. By comparing the two, you can identify objects (especially “detached DOM nodes”) that are still in memory when they should have been garbage collected.
Production Debugging with Error Tracking
Bugs that only appear in production are the hardest to solve because you don’t have access to developer tools. This is where error tracking and monitoring services like Sentry, LogRocket, or Datadog become vital. These tools are integrated into your application via a small script and automatically capture unhandled JavaScript errors in real-time. For each error, they provide a detailed report including:
- The full stack trace (made readable by source maps).
- Browser and OS information of the user.
- The user’s recent actions (breadcrumbs) leading up to the error.
- Network request logs and console output.
This level of insight into production errors is invaluable for rapid bug fixing and maintaining application health.
Best Practices for an Efficient Debugging Workflow
Adopting a structured approach and leveraging the right tools can dramatically improve your debugging efficiency. Here are some best practices to incorporate into your development process.
Embrace Cross-Browser Debugging
While Chromium-based browsers like Chrome and Edge are dominant, it’s a mistake to only test and debug in one browser engine. Firefox, which runs on the independent Gecko engine, often reveals bugs that are specific to Chromium. Furthermore, Firefox’s developer tools have unique strengths, particularly in CSS layout debugging. Regularly debugging in both a Chromium browser and Firefox ensures better cross-engine parity, improves the robustness of your code, and helps you build a better web for everyone.
Leverage Source Maps
In modern web development, the JavaScript you write (often TypeScript or modern ES syntax) is transpiled, bundled, and minified before it reaches the browser. This makes the code unreadable. Source maps are files that map this compiled code back to your original source. When you enable source maps in your build process, the browser’s developer tools will use them to show you your original, readable code when you’re debugging, setting breakpoints, and viewing stack traces. Debugging without source maps is nearly impossible.
Write Testable Code
The easiest bug to fix is the one that never makes it to the browser. Writing clean, modular code with unit tests and integration tests can catch a huge number of errors before you even begin manual testing. When a test fails (unit test debugging), it often points you directly to the source of the problem in a controlled environment, which is far more efficient than hunting for it in a complex, running application.
Conclusion: Becoming a Debugging Expert
Frontend debugging is a deep and multifaceted discipline that evolves alongside web technologies. While the journey begins with mastering the fundamentals of browser developer tools, true expertise comes from expanding your toolkit to include framework-specific inspectors, performance profilers, and production error monitoring systems. By adopting a systematic approach—reproducing the bug, forming a hypothesis, testing it with the right tools, and implementing a fix—you can turn debugging from a frustrating chore into a rewarding intellectual challenge. Remember to leverage the unique strengths of different browser engines, write testable code, and never stop exploring the powerful debugging tools at your disposal. This commitment to quality and craftsmanship is what ultimately defines a great frontend developer.