Frontend debugging has evolved significantly from the early days of alert boxes and scattered logging statements. In the modern web ecosystem, where Single Page Applications (SPAs) manage complex state, asynchronous network requests, and intricate DOM manipulations, the ability to effectively diagnose and resolve issues is a critical skill. As applications scale, the line between Frontend Debugging and full-stack troubleshooting blurs, requiring developers to master a suite of sophisticated Web Development Tools.
Today, JavaScript Debugging involves far more than syntax checking. It encompasses performance profiling, memory leak detection, network analysis, and increasingly, the integration of AI-assisted tools that provide deep visibility into the application’s runtime environment. Whether you are engaged in React Debugging, Vue Debugging, or optimizing vanilla JavaScript, understanding the layers of the browser stack is essential. This article provides a comprehensive guide to modern debugging methodologies, exploring core concepts, framework-specific strategies, and advanced techniques that leverage the latest in Developer Tools.
Core Concepts: Beyond the Console
At the heart of Code Debugging lies the browser’s DevTools. While the Console is the most familiar tab, relying solely on console.log is inefficient for complex Software Debugging. To truly master Browser Debugging, one must understand the execution context, the call stack, and how to pause execution non-destructively.
Breakpoints and Control Flow
The most powerful tool in Chrome DevTools is the breakpoint. Unlike a log statement, a breakpoint pauses the JavaScript runtime, allowing you to inspect variable values, the scope chain, and the Stack Traces at a specific moment in time. There are several types of breakpoints:
- Line-of-code breakpoints: Pause on a specific line.
- Conditional breakpoints: Pause only when a specific expression evaluates to true.
- DOM change breakpoints: Pause when a specific DOM node is modified or removed.
- XHR/Fetch breakpoints: Pause when a network request is initiated.
One common pitfall in JavaScript Development is debugging asynchronous code. When using async/await or Promises, the execution flow jumps between the event loop and the call stack. Using the debugger; statement within your code is a programmatic way to trigger a breakpoint, which is particularly useful in complex logic branches.
Here is an example of debugging a complex calculation where a conditional breakpoint would save time compared to logging every iteration:
/**
 * Calculates the factorial of a number with a deliberate bug for debugging practice.
 * Use a conditional breakpoint inside the loop: "i === 500" to inspect state mid-execution.
 */
function calculateFactorial(n) {
    if (n < 0) return -1;
    if (n === 0) return 1;

    let result = 1;

    // Programmatic breakpoint for critical state inspection
    debugger;

    for (let i = 1; i <= n; i++) {
        result *= i;

        // Simulating a logic error that only happens at high values
        if (i > 100 && result === Infinity) {
            console.error("Overflow error detected at iteration:", i);
            break;
        }
    }

    return result;
}

const value = calculateFactorial(175);
console.log(`Factorial Result: ${value}`);
In the example above, the debugger; statement forces the browser to open the Debug Console. This allows you to step through the loop and watch how the result variable changes, helping you identify exactly when JavaScript numbers lose precision or hit Infinity.
Implementation: Framework-Specific Debugging Strategies
Modern web development relies heavily on frameworks. React Debugging, Angular Debugging, and Vue Debugging require specialized approaches because the DOM is often an abstraction of the internal state. Inspecting the raw HTML elements often won’t tell you why a component rendered incorrectly; you need to inspect the Virtual DOM or the component tree.
Handling Errors in Component-Based Architectures
A critical aspect of Application Debugging in frameworks like React is handling runtime crashes. If a JavaScript error occurs inside a component’s lifecycle, it can unmount the entire application tree, resulting in a blank white screen. This makes Bug Fixing difficult because the UI disappears.
To mitigate this, developers implement Error Boundaries. These are specialized components that catch JavaScript Errors anywhere in their child component tree, log those errors, and display a fallback UI. This is a prime example of proactive Error Tracking.
import React from 'react';

/**
 * A robust Error Boundary component for React Debugging.
 * Catches errors in the component tree and logs them.
 */
class ErrorBoundary extends React.Component {
  constructor(props) {
    super(props);
    this.state = { hasError: false, error: null, errorInfo: null };
  }

  static getDerivedStateFromError(error) {
    // Update state so the next render will show the fallback UI.
    return { hasError: true };
  }

  componentDidCatch(error, errorInfo) {
    // You can also log the error to an error reporting service
    console.group("React Error Boundary Caught an Exception");
    console.error("Error:", error);
    console.error("Stack:", errorInfo.componentStack);
    console.groupEnd();

    // Hypothetical external logging service
    // logErrorToService(error, errorInfo);
  }

  render() {
    if (this.state.hasError) {
      return (
        <div className="error-container">
          <h2>Something went wrong.</h2>
          <details style={{ whiteSpace: 'pre-wrap' }}>
            {this.state.error && this.state.error.toString()}
            <br />
            {this.state.errorInfo && this.state.errorInfo.componentStack}
          </details>
        </div>
      );
    }

    return this.props.children;
  }
}

export default ErrorBoundary;
By wrapping your main application or specific widgets in this ErrorBoundary, you gain visibility into Production Debugging scenarios where you might not have access to local DevTools. This pattern is essential for maintaining stability in TypeScript Debugging workflows as well, ensuring that type mismatches at runtime don’t crash the user experience.
Advanced Techniques: Network, Memory, and Automation
Once the logic and UI are stable, debugging shifts to System Debugging: interactions with APIs, memory management, and performance. Network Debugging is often the bridge between Frontend Debugging and Backend Debugging.
Intercepting and Mocking Network Requests
When performing API Debugging, waiting for the backend team to fix an endpoint can block frontend progress. Modern Web Debugging techniques involve intercepting network requests to mock responses or inject errors to test resilience. While tools like Postman are great, you can also monkey-patch the fetch API directly in your development environment to log or modify requests on the fly.
This technique is invaluable for Integration Debugging and verifying how your application handles Node.js Errors or 500 server errors without actually crashing the server.
/**
 * Advanced Network Debugging: Intercepting Fetch API
 * This allows developers to log all outgoing requests and simulate slow networks
 * or specific API errors useful for testing loading states.
 */
const originalFetch = window.fetch;

window.fetch = async (...args) => {
    const [resource, config] = args;

    // Start a performance timer
    const startTime = performance.now();

    console.groupCollapsed(`🌐 Network Request: ${resource}`);
    console.log("Config:", config);

    try {
        const response = await originalFetch(...args);

        const duration = performance.now() - startTime;
        console.log(`Status: ${response.status}`);
        console.log(`Duration: ${duration.toFixed(2)}ms`);

        // Clone response to read body without consuming it for the app
        const clone = response.clone();
        try {
            const data = await clone.json();
            console.log("Response Body:", data);
        } catch (e) {
            console.log("Response is not JSON");
        }

        console.groupEnd();
        return response;
    } catch (error) {
        console.error("Network Failure:", error);
        console.groupEnd();
        throw error;
    }
};
Memory Leaks and Performance Profiling
Memory Debugging is often overlooked until an application becomes sluggish. In Single Page Applications, memory leaks occur when event listeners are not removed or when DOM nodes are detached but still referenced by JavaScript. Chrome’s “Memory” tab allows you to take heap snapshots. Comparing snapshots over time (e.g., before and after opening a modal) reveals objects that aren’t being garbage collected.
For Debug Performance, using the Performance API allows you to create custom markers in the timeline. This is crucial for Full Stack Debugging where you need to correlate frontend rendering times with backend latency.
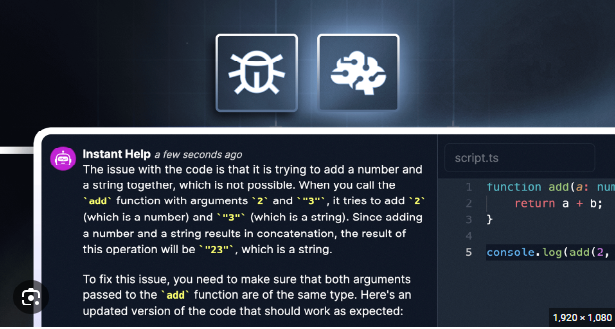
The Rise of AI and Visual Analysis
We are entering a new era of Debug Automation. New protocols and tools are emerging that allow AI models to “see” the browser context—analyzing the DOM structure, capturing screenshots, and reading console logs simultaneously. This holistic visibility allows for automated root cause analysis.
Imagine a scenario where a layout bug only appears on specific screen sizes. Traditional Unit Test Debugging might miss this. However, tools capable of visual introspection can capture the rendered state (screenshot) alongside the DOM tree and computed styles, effectively correlating visual artifacts with code logic. This convergence of visual data and code analysis is the future of Mobile Debugging and responsive design troubleshooting.
Best Practices and Optimization
Effective debugging is not just about fixing bugs; it is about establishing a workflow that prevents them. Whether you are doing Python Development for the backend or Node.js Development for the middleware, the following best practices apply to the frontend consumption layer.
Source Maps and Production Debugging
You should never debug minified code if you can avoid it. Source maps map your minified production code back to your original source files (TypeScript, Sass, ES6). Ensure your build pipeline (Webpack, Vite, or Rollup) generates source maps. However, for security, consider uploading source maps to a private monitoring service rather than exposing them publicly.
Server-Side Context for Frontend Issues
Sometimes a frontend bug is actually a data shape issue. When performing Django Debugging, Flask Debugging, or working with Express Debugging, ensure your API sends detailed error messages in development mode. Below is a Python snippet for a Flask backend that aids frontend developers by providing detailed tracebacks in JSON format during development.

from flask import Flask, jsonify
import traceback
import sys

app = Flask(__name__)

# Middleware to catch backend errors and send stack traces to frontend
# strictly for development environments.
@app.errorhandler(Exception)
def handle_exception(e):
    # Pass through HTTP errors
    if hasattr(e, 'code'):
        return e

    # Get the stack trace
    exc_type, exc_value, exc_traceback = sys.exc_info()
    tb_lines = traceback.format_exception(exc_type, exc_value, exc_traceback)

    response = {
        "error": "Internal Server Error",
        "message": str(e),
        "debug_trace": tb_lines  # Frontend can log this to console
    }

    # Return 500 with detailed JSON for easier API Debugging
    return jsonify(response), 500

@app.route('/api/data')
def get_data():
    # Simulate a Python Error
    result = 1 / 0
    return jsonify({"result": result})

if __name__ == '__main__':
    app.run(debug=True)
By implementing this, a frontend developer inspecting the Network Debugging tab will see the exact Python stack trace in the JSON response, significantly speeding up Full Stack Debugging.
Logging and Telemetry
For Remote Debugging, rely on telemetry. Tools like Sentry, LogRocket, or Datadog allow you to replay user sessions. This is vital for CI/CD Debugging and post-deployment monitoring. Instead of asking users “what happened?”, you can watch a video-like replay of their session, complete with console logs and network requests. This is the ultimate form of Dynamic Analysis.
Conclusion
Mastering Frontend Debugging requires a blend of fundamental knowledge and familiarity with modern Debugging Techniques. From utilizing debugger statements and Chrome DevTools to implementing React Error Boundaries and intercepting network requests, the toolkit available to developers is vast.
As the industry moves toward AI-assisted workflows, the ability to capture and analyze the full context of an application—DOM, visual screenshots, network activity, and console logs—will become the standard. However, these advanced tools rely on the developer’s ability to interpret the data. By following Debugging Best Practices, such as using source maps, automating Error Monitoring, and understanding the interaction between Microservices Debugging and the frontend, you can reduce downtime and deliver robust, high-performance web applications. The future of debugging is not just about finding errors; it is about total system visibility.