Introduction
In the landscape of modern software development, the difference between a fragile prototype and a robust enterprise application often lies in the maturity of its error monitoring and observability infrastructure. As systems evolve from monolithic structures to distributed microservices and, more recently, to non-deterministic AI agent workflows, the complexity of identifying failure points has increased exponentially. “It works on my machine” is no longer a valid defense; today, engineering teams must master Production Debugging and proactive Error Tracking to ensure reliability.
Error monitoring is not merely about capturing a crash; it is about understanding the context, the user journey, and the system state that led to an anomaly. Whether you are engaged in Node.js Development, Python Development, or building complex frontend interfaces, the ability to rapidly diagnose and fix issues reduces Mean Time to Resolution (MTTR) and protects user trust.
This article provides a comprehensive deep dive into the architecture of error monitoring. We will explore how to move beyond basic console logs to implement sophisticated Error Monitoring strategies that cover everything from standard API Debugging to the nuances of evaluating AI agents. We will examine Debugging Best Practices, dissect Stack Traces, and implement practical code solutions for Full Stack Debugging.
Section 1: The Foundation of Structured Logging and Error Capture
Before implementing complex Error Tracking tools, developers must establish a solid foundation of structured logging. In many Debugging Techniques, the primary pitfall is unstructured text logging that makes Code Analysis difficult at scale.
Understanding the Error Lifecycle
An error in a production environment passes through several stages: detection, capture, enrichment, and reporting. In Python Debugging or JavaScript Debugging, simply printing an error message is insufficient. You need to capture the Stack Trace, the local variables, and the severity level.
Structured logging involves outputting logs in a machine-readable format (usually JSON). This allows Log Management systems to index fields, making it easier to filter by user ID, error type, or service version.
Implementing Robust Logging in Python
Python is a dominant language for backend services and AI workflows. The standard `logging` library is powerful but requires configuration to be effective for System Debugging.
Below is an example of a configured logger that captures context and formats output as JSON, essential for modern Backend Debugging.
import logging
import json
import traceback
import sys
from datetime import datetime

class JsonFormatter(logging.Formatter):
    """
    Formatter that outputs JSON strings after parsing the LogRecord.
    Essential for integrating with modern Error Monitoring tools.
    """
    def format(self, record):
        log_record = {
            "timestamp": datetime.utcnow().isoformat(),
            "level": record.levelname,
            "message": record.getMessage(),
            "module": record.module,
            "function": record.funcName,
            "line": record.lineno
        }

        # If there is exception info, attach the stack trace
        if record.exc_info:
            log_record["exception"] = traceback.format_exception(*record.exc_info)

        return json.dumps(log_record)

def setup_logger():
    logger = logging.getLogger("ProdLogger")
    logger.setLevel(logging.INFO)

    handler = logging.StreamHandler(sys.stdout)
    handler.setFormatter(JsonFormatter())

    logger.addHandler(handler)
    return logger

logger = setup_logger()

def risky_operation(data):
    try:
        # Simulating a potential logic error
        result = 100 / data['value']
        logger.info(f"Operation successful: {result}")
        return result
    except Exception as e:
        # Capturing the error with full context
        logger.error("Critical failure in risky_operation", exc_info=True)
        # Re-raising or handling gracefully depends on the architecture
        return None

# Example Usage
risky_operation({'value': 0})
The Role of Stack Traces
In the code above, `exc_info=True` is critical. It ensures the Stack Trace is included. A stack trace provides the lineage of the error, showing exactly which function calls led to the exception. In Application Debugging, reading a stack trace effectively is the first step in Bug Fixing. It allows you to pinpoint the exact line of code where the logic diverged from expectations.
Section 2: Centralized Error Monitoring in Web Applications
Artificial intelligence analyzing image – Convergence of artificial intelligence with social media: A …
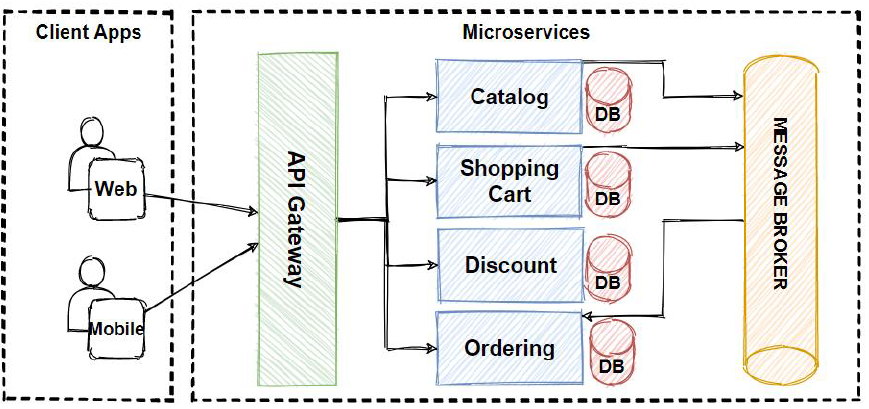
Moving from scripts to web servers, Node.js Debugging and API Development require a centralized approach. In a microservices architecture or a monolithic API, errors often cascade. A database timeout might manifest as a 500 error in the frontend.
Middleware for Error Handling
In frameworks like Express (Node.js) or Django/Flask (Python), error handling middleware is the gatekeeper. It intercepts exceptions, sanitizes them (to avoid leaking sensitive info like database credentials), and sends them to Error Monitoring platforms (like Sentry, Datadog, or New Relic).
Effective Web Development Tools integrate directly into this layer. Here is how you can implement a centralized error handling middleware in Node.js that distinguishes between operational errors (expected) and programmer errors (bugs).
const express = require('express');
const app = express();

// Custom Error Class for operational errors
class AppError extends Error {
  constructor(message, statusCode) {
    super(message);
    this.statusCode = statusCode;
    this.status = `${statusCode}`.startsWith('4') ? 'fail' : 'error';
    this.isOperational = true; // Marks error as expected (e.g., user input error)

    Error.captureStackTrace(this, this.constructor);
  }
}

// Mock function to simulate an external monitoring service
const sendToMonitoringService = (err) => {
  console.log(`[Alert] Sending error to monitoring: ${err.message}`);
  // In production, this would use an SDK like Sentry.captureException(err)
};

// 1. Controller that might fail
app.get('/api/users/:id', (req, res, next) => {
  const userId = req.params.id;

  if (userId === 'bad_input') {
    return next(new AppError('Invalid User ID format', 400));
  }

  // Simulating an unexpected crash (Programmer Error)
  if (userId === 'crash') {
    const data = undefined;
    console.log(data.name); // This will throw TypeError
  }

  res.status(200).json({ status: 'success', data: { id: userId } });
});

// 2. Global Error Handling Middleware
app.use((err, req, res, next) => {
  err.statusCode = err.statusCode || 500;
  err.status = err.status || 'error';

  // Log to monitoring service if it's not a simple validation error
  if (!err.isOperational || err.statusCode === 500) {
    sendToMonitoringService(err);
  }

  // Development: Send full stack trace
  if (process.env.NODE_ENV === 'development') {
    res.status(err.statusCode).json({
      status: err.status,
      error: err,
      message: err.message,
      stack: err.stack
    });
  } else {
    // Production: Don't leak stack traces to the client
    if (err.isOperational) {
      res.status(err.statusCode).json({
        status: err.status,
        message: err.message
      });
    } else {
      // Generic message for unknown bugs
      console.error('ERROR 💥', err);
      res.status(500).json({
        status: 'error',
        message: 'Something went very wrong!'
      });
    }
  }
});

app.listen(3000, () => {
  console.log('Server running on port 3000');
});
Context is King
In the example above, the distinction between development and production output is vital for Security and Debugging Best Practices. Furthermore, when sending data to an Error Tracking tool, you should enrich the event with:
- User Context: Who experienced the error? (ID, Email, Tier)
- Tags: Environment (Staging/Prod), Version (Commit Hash).
- Breadcrumbs: What happened before the error? (Database queries, HTTP requests).
Section 3: Advanced Monitoring for Agents and Microservices
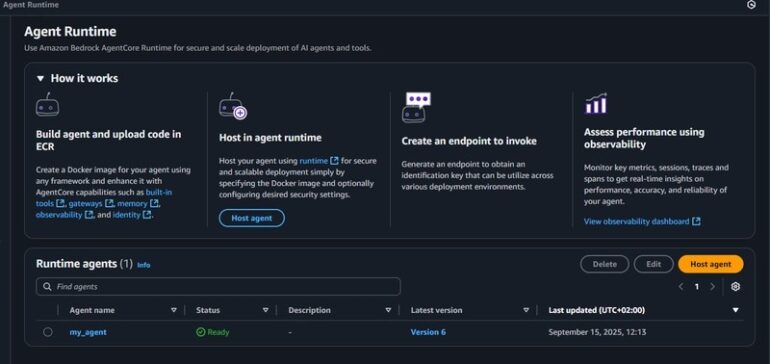
As the industry shifts toward AI-driven applications, Debugging Frameworks must adapt. Debugging a deterministic function is different from evaluating a probabilistic AI agent. This requires a shift from simple error catching to Observability and Evaluation.
Tracing and Observability
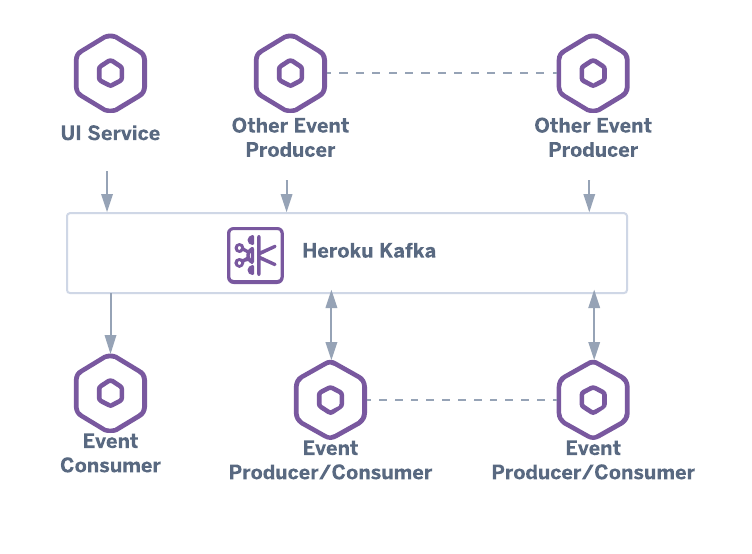
In Microservices Debugging and AI workflows, a single request might traverse multiple services or LLM calls. Distributed Tracing allows you to visualize this path. If an agent fails to perform a task, it might not be a code exception—it could be a “hallucination” or an output format error.
Tools like LangSmith or Weave are becoming standard for this, but the underlying concept is Dynamic Analysis of execution chains. You need to monitor the inputs, outputs, and latency of every step.
Below is a Python implementation of a decorator-based tracing system that mimics how one might instrument an AI agent for Performance Monitoring and error evaluation.
import time
import functools
import uuid

# Mock storage for traces (in reality, this goes to a DB or Observability tool)
trace_storage = []

def trace_agent_step(step_name):
    """
    Decorator to trace execution time, inputs, outputs, and errors
    of an agentic workflow step.
    """
    def decorator(func):
        @functools.wraps(func)
        def wrapper(*args, **kwargs):
            trace_id = str(uuid.uuid4())
            start_time = time.time()
            error = None
            result = None

            # Context for the trace
            trace_data = {
                "trace_id": trace_id,
                "step": step_name,
                "inputs": {"args": args, "kwargs": kwargs},
                "timestamp": start_time
            }

            try:
                # Execute the actual function (e.g., LLM call or Tool use)
                result = func(*args, **kwargs)
                trace_data["outputs"] = result
                trace_data["status"] = "success"
            except Exception as e:
                error = e
                trace_data["status"] = "error"
                trace_data["error_message"] = str(e)
                trace_data["stack_trace"] = traceback.format_exc()
                raise e # Re-raise to ensure flow control handles it
            finally:
                end_time = time.time()
                trace_data["duration_ms"] = (end_time - start_time) * 1000

                # Store the telemetry
                trace_storage.append(trace_data)

                # In a real scenario, this is where you'd send data to
                # LangSmith, Datadog, or similar tools.
                print(f"[{step_name}] Trace captured. Status: {trace_data['status']}")

            return result
        return wrapper
    return decorator

# Simulating an AI Agent Tool
@trace_agent_step("search_tool")
def search_knowledge_base(query):
    if "forbidden" in query:
        raise ValueError("Policy Violation: Unsafe query detected.")
    return f"Results for {query}"

@trace_agent_step("response_generator")
def generate_response(context):
    # Simulating LLM processing
    time.sleep(0.1)
    return f"AI Response based on {context}"

# Execution
try:
    data = search_knowledge_base("how to configure docker")
    response = generate_response(data)
except Exception as e:
    print(f"Workflow failed: {e}")

# Inspecting Traces for Debugging
print(f"\nTotal Traces Captured: {len(trace_storage)}")
Evaluating Agent Reliability
In the context of AI Development, error monitoring extends to “Evaluation.” You aren’t just looking for crashes; you are looking for semantic errors. Did the agent hallucinate? Did it use the tool correctly?
By wrapping functions with tracing logic (as shown above), you can aggregate data to calculate reliability metrics. This is crucial for Safe tool use and Hallucination control.
Section 4: Frontend and User-Centric Debugging
While backend logs are essential, they don’t capture the user’s visual experience. Frontend Debugging involves handling JavaScript Errors that occur in the browser.
React Error Boundaries
Artificial intelligence analyzing image – Artificial Intelligence Tags – SubmitShop
In modern frameworks like React, a JavaScript error in a part of the UI should not break the whole application. React Debugging utilizes “Error Boundaries” to catch errors in the component tree. This is a prime example of defensive programming in Web Development.
import React from 'react';

class ErrorBoundary extends React.Component {
  constructor(props) {
    super(props);
    this.state = { hasError: false, errorId: null };
  }

  static getDerivedStateFromError(error) {
    // Update state so the next render will show the fallback UI.
    return { hasError: true };
  }

  componentDidCatch(error, errorInfo) {
    // 1. Generate a correlation ID for user support
    const errorId = `ERR-${Date.now()}`;
    this.setState({ errorId });

    // 2. Log the error to an error reporting service
    console.group("Captured by Error Boundary");
    console.error("Error:", error);
    console.error("Component Stack:", errorInfo.componentStack);
    console.groupEnd();

    // Example: logToService(error, errorInfo, errorId);
  }

  render() {
    if (this.state.hasError) {
      // You can render any custom fallback UI
      return (
        <div className="error-container">
          <h2>Something went wrong.</h2>
          <p>Please quote error ID: <strong>{this.state.errorId}</strong> when contacting support.</p>
          <button onClick={() => window.location.reload()}>Reload Page</button>
        </div>
      );
    }

    return this.props.children;
  }
}

// Usage
// <ErrorBoundary>
//   <MyWidget />
// </ErrorBoundary>
Browser Debugging Tools
For Chrome DevTools and general Browser Debugging, developers should leverage Source Maps. Source maps reconstruct the original source code from the minified production code, allowing you to see the exact line where a TypeScript Debugging session failed, rather than a minified variable name like `a.b()`.
Best Practices for Production Error Monitoring
To reach a high level of maturity in Software Debugging and monitoring, consider these best practices:
1. Alert Fatigue Management
Error Monitoring tools can be noisy. If you receive 500 emails a day about “Warning: Deprecated API,” you will ignore the critical “Database Down” alert. Configure alert thresholds. Use “spikes” (e.g., if error rate > 1%) rather than absolute numbers to trigger pages.
2. Privacy and PII Scrubbing
Artificial intelligence analyzing image – Artificial intelligence in healthcare: A bibliometric analysis …
When performing Remote Debugging or analyzing logs, ensure you are not logging Personally Identifiable Information (PII) like passwords, credit card numbers, or emails. Configure your logging libraries and Error Tracking agents to scrub these fields automatically before the data leaves the server.
3. CI/CD Integration
Integrate debugging into your pipeline. CI/CD Debugging involves running automated tests that simulate failure scenarios. If a test fails, the build should fail. Furthermore, use Docker Debugging techniques to replicate production environments locally, ensuring that environment variables and dependencies match exactly.
4. Automated Regression Testing
When a bug is fixed, write a test case that reproduces that specific bug to ensure it never returns. This transforms Bug Fixing from a reactive task to a proactive quality assurance measure.
Conclusion
Mastering Error Monitoring is a journey that spans the entire stack. It begins with writing clean code that anticipates failure using Unit Test Debugging, moves through implementing robust middleware for API Debugging, and culminates in sophisticated observability for Microservices and AI agents.
As we see the rise of autonomous agents, the definition of “error” is expanding. It now includes hallucination, latency drift, and unsafe tool usage. By leveraging the Debugging Techniques and code patterns outlined in this article—from structured Python logging to React Error Boundaries and distributed tracing—you can build systems that are not only resilient but also transparent.
The ability to say, “I know exactly why this failed, and here is the trace,” is the hallmark of a mature engineering team. Start implementing these strategies today to transform your Application Debugging from a headache into a strategic asset.