Memory management remains one of the most complex and critical aspects of software engineering. Whether you are dealing with low-level systems programming or high-level web development, the way your application handles RAM dictates its stability, performance, and security. Memory debugging is not merely about fixing crashes; it is a holistic discipline involving the detection of leaks, the optimization of allocation patterns, and the protection of sensitive data resident in volatile storage.
In the modern landscape of Software Debugging, the stakes have evolved. We are no longer just looking for segmentation faults. We are analyzing complex microservices where a memory leak in a Node.js container can bring down an entire Kubernetes cluster. We are scrutinizing System Debugging protocols to ensure that unauthorized actors cannot attach debuggers to production processes to scrape passwords or encryption keys from memory. From Python Debugging in data science pipelines to JavaScript Debugging in single-page applications, understanding the lifecycle of memory is paramount.
This comprehensive guide explores the depths of memory debugging. We will traverse the landscape of unmanaged and managed memory, implement practical code solutions for identifying leaks, and discuss the intersection of debugging and security configuration. By mastering these Debugging Techniques, developers can ensure their applications are not only performant but also resilient against both resource exhaustion and security vulnerabilities.
Section 1: The Anatomy of Memory Failures
To effectively debug memory, one must first understand where things go wrong. Memory issues generally fall into three categories: Leaks (failure to release), Corruption (writing where you shouldn’t), and Consumption (using too much). In Application Debugging, these manifest differently depending on the environment.
The Heap vs. The Stack
Understanding the distinction between the stack and the heap is fundamental. The stack is used for static memory allocation and execution threads, while the heap is used for dynamic memory allocation. Most Memory Debugging efforts focus on the heap. In languages like C++, the developer manually controls the heap. In managed languages like Java or Python, a Garbage Collector (GC) manages it, but this does not make them immune to leaks.
A classic memory leak occurs when an object is created on the heap but never deleted. Over time, these accumulate, leading to increased RAM usage and eventual system crashes. However, a more insidious issue is memory corruption, such as buffer overflows, where a program writes data past the end of an allocated array, corrupting adjacent data.
Unmanaged Memory Risks
In unmanaged environments, Code Debugging requires strict discipline. A dangling pointer—a pointer that references a memory location that has already been freed—can lead to unpredictable behavior and security exploits. Let’s look at a C++ example demonstrating a common pitfall and a modern solution using smart pointers.
#include <iostream>
#include <vector>
#include <memory>

// BAD PRACTICE: Manual memory management prone to leaks
void vulnerableFunction() {
    int* data = new int[100]; // Allocation

    // Simulate some logic
    if (true) {
        // If an exception occurs or we return early here,
        // 'data' is never deleted. This is a memory leak.
        return;
    }

    delete[] data; // This line is never reached
}

// GOOD PRACTICE: Using Smart Pointers for automatic cleanup
void safeFunction() {
    // unique_ptr automatically deallocates memory when it goes out of scope
    std::unique_ptr<int[]> safeData(new int[100]);

    // Even if we return early, the destructor for safeData is called,
    // freeing the memory preventing leaks.
    if (true) {
        return;
    }
}

int main() {
    std::cout << "Starting Memory Debugging Example..." << std::endl;

    // This call leaks 400 bytes (assuming 4-byte int)
    vulnerableFunction();

    // This call is safe
    safeFunction();

    std::cout << "Finished." << std::endl;
    return 0;
}
In the example above, Debug Tools like Valgrind or AddressSanitizer would immediately flag the vulnerableFunction for leaking blocks. Modern Software Debugging emphasizes RAII (Resource Acquisition Is Initialization) patterns, as seen in safeFunction, to prevent these issues architecturally.
Section 2: Managed Memory and Garbage Collection Analysis
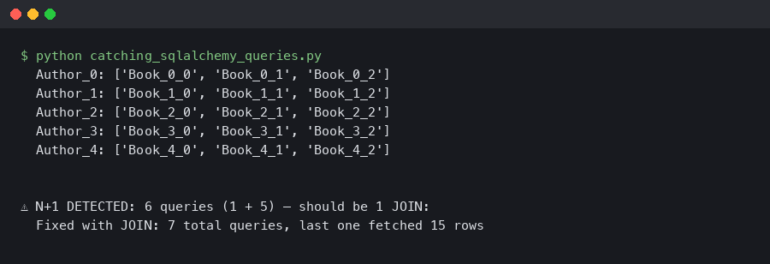
Many developers assume that Python Debugging or Node.js Debugging frees them from memory concerns. This is a dangerous misconception. While Garbage Collectors handle the heavy lifting, they rely on reference counting or reachability analysis. If you accidentally keep a reference to an object (for example, in a global cache or an event listener), the GC cannot free it. This is known as a “logical leak.”
Python Memory Profiling
In Python, circular references can sometimes confuse the reference counter, though the cyclic garbage collector usually handles them. The real danger lies in global variables or static class attributes that grow indefinitely. To debug this, we use Profiling Tools like tracemalloc.
import tracemalloc
import linecache
import os

def display_top(snapshot, key_type='lineno', limit=3):
    snapshot = snapshot.filter_traces((
        tracemalloc.Filter(False, "<frozen importlib._bootstrap>"),
        tracemalloc.Filter(False, "<unknown>"),
    ))
    top_stats = snapshot.statistics(key_type)

    print("Top %s lines" % limit)
    for index, stat in enumerate(top_stats[:limit], 1):
        frame = stat.traceback[0]
        # replace "/path/to/module/file.py" with "module/file.py"
        filename = os.sep.join(frame.filename.split(os.sep)[-2:])
        print("#%s: %s:%s: %.1f KiB"
              % (index, filename, frame.lineno, stat.size / 1024))
        line = linecache.getline(frame.filename, frame.lineno).strip()
        if line:
            print('    %s' % line)

# Start tracing memory allocations
tracemalloc.start()

# Simulate a memory leak
leaky_list = []
def create_leak():
    # Appending 1MB of data repeatedly
    leaky_list.append(b'x' * 1024 * 1024)

# Run the leaky function
for _ in range(5):
    create_leak()

# Take a snapshot
snapshot = tracemalloc.take_snapshot()
display_top(snapshot)
This Python Debugging script pinpoints exactly which line of code is allocating the most memory. By comparing snapshots before and after a specific operation, developers can identify objects that persist when they should have been collected.
Node.js and Closure Leaks
Node.js Development often involves heavy use of closures and callbacks. A common JavaScript Debugging scenario involves closures holding onto large scopes unnecessarily. This is frequently seen in Backend Debugging where a server process runs for weeks, slowly accumulating memory until an “Out of Memory” crash occurs.
// Node.js Memory Leak Example
const heapdump = require('heapdump'); // Useful for generating snapshots
let leaks = [];
function replaceThing() {
const originalThing = leaks.length > 0 ? leaks[leaks.length - 1] : null;
const unused = function () {
// This closure references 'originalThing'
if (originalThing) console.log("hi");
};
// The 'thing' object is what we actually push to the array
const thing = {
longStr: new Array(1000000).join('*'),
someMethod: function () {
console.log('message');
}
};
// CRITICAL: 'thing.someMethod' shares a closure scope with 'unused'.
// Because 'unused' references 'originalThing', 'originalThing' cannot be GC'd
// as long as the scope exists. 'thing' keeps the scope alive.
// This creates a chain of retained memory.
leaks.push(thing);
}
setInterval(() => {
replaceThing();
const used = process.memoryUsage().heapUsed / 1024 / 1024;
console.log(`Heap used: ${Math.round(used * 100) / 100} MB`);
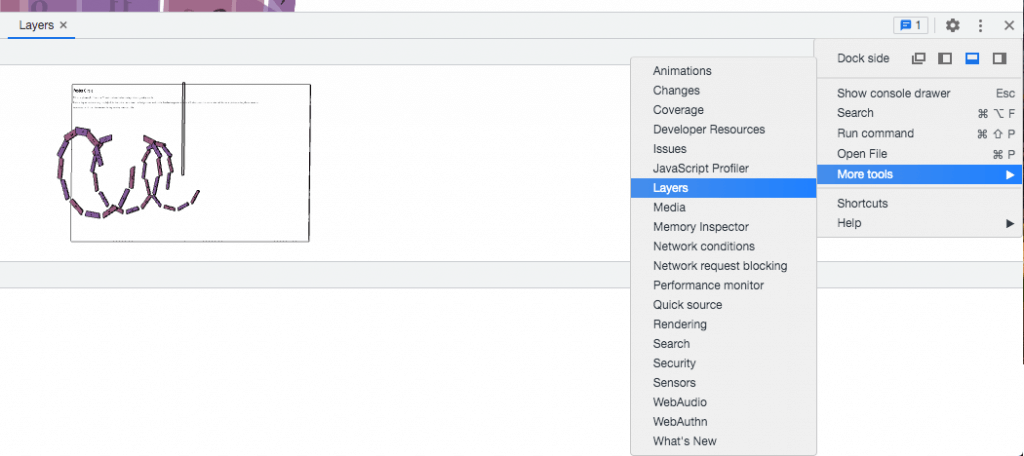
}, 1000);In this Node.js Debugging example, the `unused` function prevents the garbage collector from cleaning up previous allocations. Chrome DevTools can be attached to Node.js instances to visualize these retained paths using Heap Snapshots.
Section 3: Advanced Techniques and Security Implications
Memory debugging is not just about stability; it is a critical component of security. System Debugging privileges allow deep access to a running process. If a debugger is attached to a production system, it can read memory contents, including decrypted SSL keys, user passwords, and environment variables. This is why configuring debug programs and restricting rights (often via policies like Intune or Group Policy) is a vital defense-in-depth strategy.
Secure Memory Handling
When performing API Development or handling sensitive data, developers should minimize the time secrets stay in memory. In languages like C# or Java, strings are immutable, meaning a password might linger in memory until the GC runs. Using secure alternatives is a best practice in Application Debugging and security hardening.
Below is a C# example using SecureString (though modern .NET suggests byte arrays for pinning) to demonstrate the concept of minimizing memory exposure.
using System;
using System.Security;
using System.Runtime.InteropServices;

public class MemorySecurityDemo {
    public static void Main() {
        Console.WriteLine("Secure Memory Handling Demo");

        // Standard string: stays in memory until GC collects it
        string sensitiveData = "MySuperSecretPassword";

        // SecureString: Encrypted in memory, pinned so it's not swapped to disk
        using (SecureString securePwd = new SecureString()) {
            foreach (char c in sensitiveData) {
                securePwd.AppendChar(c);
            }
            securePwd.MakeReadOnly();

            // Accessing the secure data requires explicit marshalling
            IntPtr unmanagedString = IntPtr.Zero;
            try {
                unmanagedString = Marshal.SecureStringToGlobalAllocUnicode(securePwd);
                Console.WriteLine("SecureString allocated at: " + unmanagedString);

                // Perform operations...

            } finally {
                // CRITICAL: Zero out the memory immediately after use
                if (unmanagedString != IntPtr.Zero) {
                    Marshal.ZeroFreeGlobalAllocUnicode(unmanagedString);
                    Console.WriteLine("Memory zeroed and freed.");
                }
            }
        }
    }
}
This approach is crucial for Backend Debugging in high-security environments. If an attacker manages to dump the process memory (a common technique in post-exploitation), standard strings are easily readable. Zeroing out memory explicitly mitigates this risk.
Remote Debugging and Production Risks
Remote Debugging is a powerful tool for diagnosing issues in Docker Debugging or Kubernetes Debugging scenarios. However, exposing debug ports (like Java JDWP or Node.js Inspector) to the public internet or untrusted networks is a massive vulnerability. It effectively grants Remote Code Execution (RCE) capabilities.

When debugging microservices, use Static Analysis tools during the build phase to catch leaks, and rely on Performance Monitoring and Error Tracking tools (like Sentry, Datadog, or Prometheus) in production, rather than attaching live debuggers. If live debugging is necessary, it should be done through secure tunnels with strict access controls.
Section 4: Best Practices and Optimization Strategies
To master Memory Debugging, one must move from reactive bug fixing to proactive optimization. Here are the pillars of a robust memory strategy:
1. Integrate Profiling into CI/CD
Don’t wait for production to crash. Incorporate Profiling Tools into your CI/CD Debugging pipelines. For Go Debugging, use `pprof` to generate heap profiles during load tests. For React Debugging, use the React Profiler to ensure components are not re-rendering and allocating unnecessary objects.
2. Understand Your Framework’s Lifecycle
Whether it is Angular Debugging, Vue Debugging, or Django Debugging, every framework has a lifecycle. Components mount and unmount. Requests start and finish. Ensure that any subscription, timer, or event listener created in a “setup” phase is torn down in the “teardown” phase. This is the number one cause of memory leaks in Frontend Debugging.
3. Monitor System Metrics
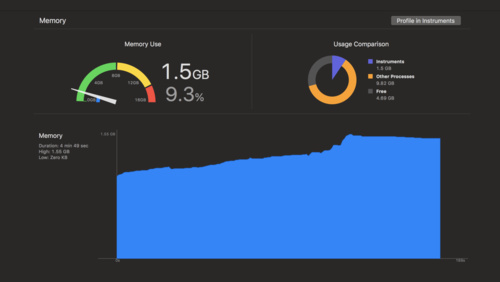
Use Error Monitoring and Performance Monitoring solutions to track “Resident Set Size” (RSS) and “Heap Used” over time. A “sawtooth” pattern is healthy (allocation followed by GC). A “staircase” pattern (allocation without full recovery) indicates a leak. Tools designed for Microservices Debugging can correlate high memory usage with specific API endpoints.
4. Secure the Debugger
As discussed, access to memory is access to secrets. Ensure that only trusted administrators have rights to debug programs. In Windows environments, this involves managing the `SeDebugPrivilege`. In Linux, it involves capabilities like `CAP_SYS_PTRACE`. Hardening these configurations prevents malware from injecting code or scraping memory from your legitimate applications.
Conclusion
Memory debugging is a multi-faceted discipline that bridges the gap between code performance and system security. From the low-level pointer management in C++ to the complex closure scopes of Node.js Development, the principles remain consistent: allocate responsibly, track references diligently, and release resources immediately.
As applications become more distributed and rely heavily on Cloud Debugging and containerization, the visibility into memory becomes harder to achieve but more critical to maintain. By utilizing Static Analysis, leveraging Dynamic Analysis tools like tracemalloc and Valgrind, and adhering to strict security policies regarding debug privileges, developers can build software that is robust, efficient, and secure. The future of Software Debugging is not just about fixing bugs; it is about designing systems that are transparent, observable, and resilient by default.