
Introduction: Moving Beyond “It Works” to “It’s Fast”
In the world of software development, getting code to function correctly is only half the battle. A feature might pass all its unit tests and work flawlessly on a developer’s machine, but if it grinds to a halt under real-world load, it’s a failure. This is where the discipline of performance optimization comes in, and its most crucial weapon is the profiler. While debugging focuses on correctness—fixing bugs and ensuring the logic is sound—profiling focuses on efficiency. It’s a form of dynamic analysis that helps us answer critical questions: Where is our program spending most of its time? Why is memory usage spiking? Which function calls are the bottlenecks slowing everything down?
Profiling tools are specialized instruments that observe and measure an application’s behavior as it runs. They collect data on resource consumption, such as CPU cycles, memory allocations, and I/O operations, attributing this usage back to specific functions, lines of code, or even individual instructions. By pinpointing these “hotspots,” developers can move from guesswork to data-driven optimization, ensuring their applications are not just functional but also fast, responsive, and scalable. This article provides a comprehensive guide to understanding and using profiling tools, transforming them from an occasional diagnostic tool into an integral part of your development workflow.
Section 1: The Core Concepts of Code Profiling
Before diving into specific tools, it’s essential to understand the fundamental principles behind profiling. At its core, profiling is about measurement and attribution. It provides a quantitative look at your code’s performance characteristics, allowing you to make informed decisions about optimization.
What Do Profilers Measure?
Profilers can track various metrics, but they generally fall into a few key categories:
- CPU Time: This is the most common metric. It measures how much time the CPU spends executing different parts of your code. This helps identify computationally expensive functions that are prime candidates for optimization.
- Memory Usage: Memory profilers track memory allocations and deallocations. They are invaluable for Memory Debugging, helping to find memory leaks (where memory is allocated but never released) or areas of excessive allocation that can lead to performance degradation and crashes.
- I/O Operations: Applications often spend significant time waiting for disk reads/writes or network requests. Profilers can highlight these I/O-bound operations, suggesting that optimizations might lie in caching, batching requests, or using asynchronous patterns.
- Wall-Clock Time: This measures the total real-world time elapsed during a function’s execution, including time spent waiting for I/O or sleeping. It provides a holistic view of a function’s impact on user-perceived latency.
Types of Profiling: Deterministic vs. Sampling
Profilers collect data using two primary methods:
- Deterministic Profiling (or Instrumentation): This method injects measurement code directly into the program at the beginning and end of every function call. It provides exact call counts and precise timing information. While highly accurate, this instrumentation adds overhead, which can sometimes alter the program’s performance characteristics.
- Statistical Profiling (or Sampling): This method takes periodic “snapshots” of the program’s call stack at a high frequency (e.g., hundreds or thousands of times per second). It then aggregates this data to build a statistical picture of where the program is spending its time. Sampling has much lower overhead, making it suitable for Production Debugging, but it may miss very short-lived function calls.
Visualizing Performance: Call Stacks and Flame Graphs
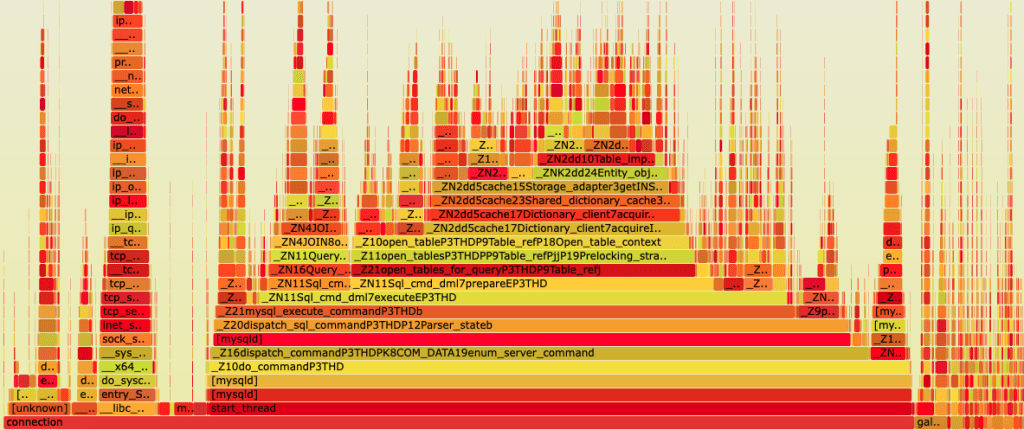
Raw profiling data is often a dense table of numbers. To make it interpretable, tools use visualizations like flame graphs. A flame graph represents the call stack over time. The width of each block shows how frequently that function was present in the stack snapshots, and the y-axis represents the stack depth. Wide blocks at the top of the graph are often the “hotspots” that demand a developer’s attention.
Consider this simple, inefficient Python function designed to find prime numbers. It’s a classic example of a CPU-bound task.
def is_prime(n):
    """A simple (and slow) function to check if a number is prime."""
    if n < 2:
        return False
    for i in range(2, n):
        if n % i == 0:
            return False
    return True

def find_primes_in_range(limit):
    """Find all primes up to a given limit."""
    primes = []
    for num in range(2, limit + 1):
        if is_prime(num):
            primes.append(num)
    return primes

if __name__ == "__main__":
    print("Finding primes up to 10000...")
    primes_found = find_primes_in_range(10000)
    print(f"Found {len(primes_found)} primes.")
Without a profiler, you might guess that the inner loop of is_prime is slow. A profiler confirms this suspicion with hard data, showing exactly how many times it was called and the cumulative time spent inside it, paving the way for targeted optimization.
Section 2: Practical Profiling in Action
Theory is useful, but profiling is a hands-on activity. Let’s explore how to use common Profiling Tools in both backend (Python) and frontend (JavaScript) development scenarios.
Backend Profiling: Python with cProfile and snakeviz
Python’s standard library includes cProfile, a deterministic profiler that is both powerful and easy to use. It provides detailed statistics on function calls. However, its raw text output can be difficult to parse. Tools like snakeviz can consume this output and generate interactive flame graphs.
Step 1: Install snakeviz
First, you’ll need to install the visualization tool: pip install snakeviz
Step 2: Run the Profiler
Using the prime number script from the previous section (saved as primes.py), we can run cProfile from the command line and direct its output to a file.
python -m cProfile -o primes.prof primes.pyThis command executes our script and saves the detailed profiling statistics into a binary file named primes.prof. The script will run slower than usual due to the profiler’s overhead.
Step 3: Visualize the Results
Now, we can use snakeviz to launch a web server that displays an interactive visualization of the profiling data.
snakeviz primes.prof
This will open a browser window showing a flame graph. You will immediately see a very wide bar for the is_prime function, confirming it’s the primary hotspot. The visualization makes it obvious that nearly all of the program’s execution time is spent within this single function, making it the clear target for any optimization efforts. This is a core part of the Python Debugging and performance tuning process.
Frontend Profiling: JavaScript with Chrome DevTools
For web applications, the browser itself provides an incredible suite of Developer Tools. The Performance tab in Chrome DevTools is a powerful sampling profiler for frontend code, crucial for JavaScript Debugging and optimization.
Let’s consider a simple web page that performs a “heavy” calculation and updates the DOM, causing a noticeable delay in the UI.
<!DOCTYPE html>
<html lang="en">
<head>
    <title>Performance Demo</title>
</head>
<body>
    <h1>Frontend Profiling Demo</h1>
    <button id="heavyTaskBtn">Run Heavy Task</button>
    <div id="output"></div>

    <script>
        function performHeavyCalculation() {
            const start = Date.now();
            let result = 0;
            // A loop to simulate a CPU-intensive task
            for (let i = 0; i < 50000000; i++) {
                result += Math.sqrt(i) * Math.sin(i);
            }
            const duration = Date.now() - start;
            return `Calculation took ${duration}ms. Result: ${result.toFixed(2)}`;
        }

        document.getElementById('heavyTaskBtn').addEventListener('click', () => {
            const resultText = performHeavyCalculation();
            document.getElementById('output').textContent = resultText;
        });
    </script>
</body>
</html>
Profiling Steps:

- Open this HTML file in Chrome and open DevTools (F12 or Ctrl+Shift+I).
- Go to the Performance tab.
- Click the “Record” button (the circle icon) to start profiling.
- Click the “Run Heavy Task” button on the web page.
- Wait for the calculation to finish, then click “Stop” in the Performance tab.
DevTools will present a detailed timeline. In the “Main” section, you’ll see a long, solid yellow bar corresponding to the button click event. This is a “Long Task” that blocks the main thread, making the UI unresponsive. By clicking on this task, you can view the flame chart in the “Bottom-Up” or “Call Tree” tabs below. It will clearly show that the vast majority of time was spent inside the performHeavyCalculation function. This kind of Web Debugging is essential for creating smooth user experiences, especially in complex frameworks like React or Angular.
Section 3: Advanced Profiling Techniques
Basic CPU profiling is a great start, but modern applications present more complex challenges, from memory management to distributed architectures.
Memory Profiling: Hunting for Leaks
Memory Debugging is critical for long-running applications like servers or single-page applications (SPAs). A memory leak can slowly consume all available RAM, leading to crashes.
In Python, the memory-profiler library provides line-by-line memory usage analysis. Consider this example where we inadvertently hold onto a large list in memory.
# To run this, you need to install memory-profiler: pip install memory-profiler
from memory_profiler import profile

# The @profile decorator tells the profiler to analyze this function
@profile
def process_large_data():
    """Function that creates a large list and returns its size."""
    print("Allocating large list...")
    # This creates a list with 10 million integers
    large_list = list(range(10_000_000))
    # In a real leak, this list might be accidentally stored in a global
    # variable or a long-lived object.
    list_size_bytes = sum(item.__sizeof__() for item in large_list)
    print(f"List size is approximately {list_size_bytes / 1024 / 1024:.2f} MiB")
    return len(large_list)

if __name__ == "__main__":
    process_large_data()
To run this with the profiler, you use the command: python -m memory_profiler memory_leak_example.py. The output will show the memory usage at each line of the process_large_data function, clearly indicating the massive memory increment when large_list is created. In Chrome DevTools, the Memory tab provides similar functionality, allowing you to take heap snapshots before and after an action to see which objects were created and not garbage collected.
Profiling in Production and Asynchronous Code
Profiling on a developer’s machine is different from profiling a live system under real load. Production Debugging requires tools with minimal overhead. This is where sampling profilers and continuous profiling platforms (like Datadog’s profiler or Google Cloud Profiler) shine. They run constantly in production, collecting low-overhead performance data that can be aggregated to spot systemic issues, regressions, or performance problems that only appear under specific traffic patterns.
Async Debugging presents another challenge. In asynchronous code (like in Node.js Development or Python’s asyncio), the call stack doesn’t always represent the true causal chain of events. Modern profilers are becoming better at handling this, often providing an “async stack” view that stitches together the logical sequence of operations across different event loop ticks, making it easier to debug performance in `async/await` code.
Profiling Microservices and Distributed Systems
In a microservices architecture, a single user request might traverse dozens of services. A CPU profiler running on one service can’t see the whole picture. For Microservices Debugging and performance analysis, profiling is often complemented by distributed tracing. Tools like Jaeger and Zipkin trace requests as they propagate through the system, assigning a unique ID to each request. This allows you to visualize the entire lifecycle of a request, see how much time was spent in each service, and identify which network call or service is the bottleneck in the distributed transaction. This is a crucial aspect of modern Backend Debugging and API Development.
Section 4: Best Practices and Common Pitfalls
Using profiling tools effectively is a skill. Following best practices can save you from chasing phantom problems or implementing useless optimizations.
Best Practices for Effective Profiling
- Profile Before You Optimize: Don’t guess where the bottleneck is. The famous quote from Donald Knuth, “premature optimization is the root of all evil,” is paramount. Use the profiler to get data and prove where the problem lies before you start changing code.
- Establish a Baseline: Always measure the performance of your application before making any changes. This baseline is your reference point to determine if your optimization was successful.
- Profile in a Production-like Environment: Performance can be drastically different depending on the hardware, network, and data. Whenever possible, profile on staging or a dedicated performance environment that mirrors production.
- Focus on the Biggest Wins: Use the profiler’s output to identify the top 1-3 hotspots. A significant improvement in a function that takes 80% of the runtime is far more valuable than optimizing a function that takes only 1%.
- Profile, Optimize, Measure Again: Optimization is an iterative cycle. After implementing a change, run the profiler again to verify its impact. Sometimes, a “fix” can make performance worse or shift the bottleneck elsewhere.
Common Pitfalls to Avoid
- Misinterpreting Profiler Overhead: Be aware that deterministic profilers add overhead. This can slightly skew results, especially for very small, frequently called functions.
- Ignoring I/O: It’s easy to focus only on CPU-bound code. If your application is slow but the CPU profile looks flat, the bottleneck is likely I/O (database queries, API calls, file access). Use tools that can measure wall-clock time and I/O wait times.
- Profiling “Hello, World”: Profile your application with realistic data and under a realistic load. Profiling a trivial case won’t reveal the performance issues that appear at scale.
Conclusion: Integrating Profiling into Your Workflow
Profiling is not a one-time fix for a slow application; it’s a continuous practice that leads to robust, efficient, and scalable software. By moving beyond simple Code Debugging to embrace performance analysis, you elevate the quality of your work. The key is to make it a habit. Profile new, complex features before they are merged. Use continuous profiling in production to catch performance regressions automatically. Teach your team how to use Profiling Tools like Chrome DevTools and cProfile as part of their standard Developer Tools toolkit.
By understanding the core concepts, mastering practical tools, and adhering to best practices, you can systematically dismantle performance bottlenecks. The journey from identifying a hotspot with a profiler to deploying a highly optimized solution is one of the most rewarding aspects of software engineering. Start profiling today, and turn your performance guesswork into a data-driven science.