

In the world of software development, one truth is universal: bugs are inevitable. They are an intrinsic part of the creative process of turning logic into functional applications. For decades, the art of debugging has been a core skill for every developer, a methodical process of hunting down and eliminating defects. However, as software systems evolve in complexity—from monolithic backends to distributed microservices and now to probabilistic AI models—our approach to testing and debugging must also evolve. The traditional binary view of “it works vs. it doesn’t” is giving way to a more nuanced understanding of system behavior.
This article provides a comprehensive guide to modern software debugging. We’ll start with the foundational principles and tools that every developer should master, explore practical techniques for both frontend and backend development, and then venture into the advanced territory of performance profiling and the new paradigm of “evals” required for debugging AI and Large Language Models (LLMs). Whether you’re fixing a simple JavaScript error or trying to understand why an AI-powered feature is producing suboptimal results, the right mindset and toolset are critical for success.
The Foundations of Debugging: Core Principles and Tools
Effective debugging is less about frantic guesswork and more about a scientific, systematic process. It begins with a mindset focused on understanding the “why” behind a failure, not just patching the symptom. This foundational approach is supported by a suite of essential developer tools that provide visibility into your code’s execution.
Adopting the Debugging Mindset
The most effective developers approach debugging with a structured methodology, often unconsciously following a loop:
- Observe: Identify and reliably reproduce the bug. A bug you can’t reproduce is a bug you can’t fix. Document the exact inputs, environment, and steps that lead to the failure.
- Hypothesize: Based on the observed behavior and your knowledge of the codebase, form a hypothesis about the root cause. What assumption is being violated? Where could the logic be failing?
- Test: Design an experiment to prove or disprove your hypothesis. This could involve adding log statements, using a debugger to inspect state at a specific point, or writing a failing unit test that isolates the issue.
- Repeat: Based on the results of your test, refine your hypothesis or form a new one. This cycle continues until the root cause is confirmed.
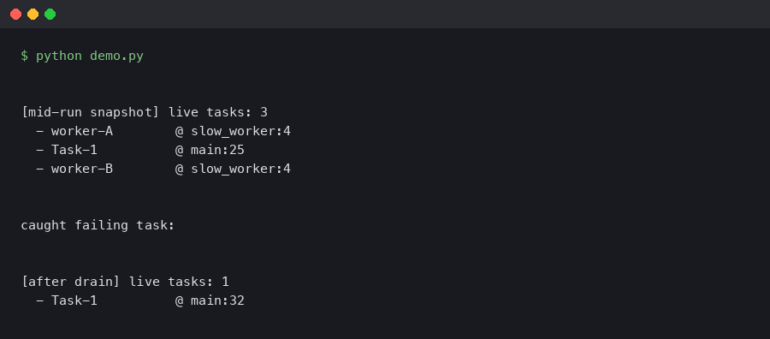
This process requires moving beyond a simple “pass/fail” mentality. In complex systems, especially those involving asynchronous operations or machine learning, the issue might not be a crash but a subtle deviation from expected behavior—a performance degradation, a race condition, or a slightly “off” AI-generated response. The goal is to understand the system’s state and logic flow completely.
Essential Tools: Logging and Interactive Debuggers
While the mindset is crucial, it’s powerless without the right tools. At the most basic level, logging is your first line of defense. Strategic log statements can create a breadcrumb trail of your application’s execution path and state changes. Modern logging frameworks allow for different log levels (e.g., DEBUG, INFO, WARN, ERROR), which help you filter noise in different environments.
Here’s a simple Python example using the built-in logging module to diagnose a faulty calculation.
import logging

# Configure basic logging
logging.basicConfig(level=logging.DEBUG,
                    format='%(asctime)s - %(levelname)s - %(message)s')

def calculate_discounted_price(price, discount_percentage):
    """
    Calculates the price after applying a discount.
    There's a subtle bug here.
    """
    logging.debug(f"Starting calculation for price={price}, discount={discount_percentage}%")

    if not isinstance(price, (int, float)) or not isinstance(discount_percentage, (int, float)):
        logging.error("Invalid input types for price or discount.")
        return None

    # Bug: The discount should be divided by 100
    # discount_factor = 1 - discount_percentage
    discount_factor = 1 - (discount_percentage / 100)

    if discount_factor < 0:
        logging.warning(f"Discount factor is negative ({discount_factor}). Price will increase.")

    final_price = price * discount_factor
    logging.debug(f"Calculated discount_factor={discount_factor}, final_price={final_price}")

    return final_price

# Test the function
price = 100
discount = 20
final = calculate_discounted_price(price, discount)

# The log output will clearly show the incorrect discount_factor if the bug is present
print(f"The final price is: ${final:.2f}")
When logging isn’t enough, an interactive debugger is your most powerful tool. Debuggers allow you to pause your code’s execution at specific points (breakpoints), inspect the state of all variables, and execute the code line-by-line (stepping). This provides an unparalleled, real-time view into your application’s internal workings.
Practical Debugging in Action: Frontend and Backend Scenarios
Theory is one thing, but debugging is a hands-on activity. Let’s explore common scenarios in both frontend JavaScript development and backend Node.js development, highlighting the specific tools and techniques for each.

Frontend Debugging with Browser DevTools
For any web developer, the browser’s built-in developer tools are indispensable. Google Chrome DevTools, in particular, offers a comprehensive suite for Web Debugging.
- Console Panel: This is your go-to for viewing log messages (
console.log,console.error,console.table) and executing arbitrary JavaScript code in the context of the page. - Sources Panel: This is the interactive debugger. You can browse your project’s source files (even for transpiled code, thanks to source maps), set breakpoints by clicking on a line number, and step through your code’s execution. You can also set conditional breakpoints that only pause execution if a certain expression is true.
- Network Panel: Crucial for API Debugging. It logs all network requests made by the page. You can inspect request headers, payloads, and server responses, making it easy to diagnose issues like malformed requests or unexpected API errors.
Imagine a simple web app that fetches user data but fails. Here’s how you’d debug it.
// script.js - Attached to an HTML file with a button and a div with id="user-info"

async function fetchUserData() {
    const userId = 1;
    const userInfoDiv = document.getElementById('user-info');

    try {
        // Bug: The URL is incorrect, it should be 'users' not 'user'
        const response = await fetch(`https://jsonplaceholder.typicode.com/user/${userId}`);

        if (!response.ok) {
            // This block will be triggered by the 404 error
            console.error(`Error fetching data: ${response.status} ${response.statusText}`);
            userInfoDiv.textContent = 'Failed to load user data.';
            return;
        }

        const userData = await response.json();
        userInfoDiv.textContent = `Name: ${userData.name}, Email: ${userData.email}`;

    } catch (error) {
        console.error('A network or parsing error occurred:', error);
        userInfoDiv.textContent = 'An unexpected error occurred.';
    }
}

document.getElementById('fetch-btn').addEventListener('click', fetchUserData);
To debug this, you would:
- Open Chrome DevTools and go to the Network tab.
- Click the button to trigger
fetchUserData. - You’d see a request to
/user/1appear in red with a404 Not Foundstatus. This immediately points to a problem with the URL. - You could also go to the Sources tab, place a breakpoint on the
fetchline, and inspect the URL variable just before the request is made.
Backend Debugging in Node.js
Debugging on the backend presents different challenges, as there’s no browser UI. However, Node.js has excellent built-in debugging capabilities that can be connected to familiar tools like Chrome DevTools.
By starting your Node.js application with the --inspect flag, you enable a debugging server. You can then connect to this server for a full-featured Remote Debugging session.
Consider this simple Express.js application with a logical error:
// server.js
const express = require('express');
const app = express();
const PORT = 3000;

app.get('/product/:id', (req, res) => {
    const { id } = req.params;
    const { minStock } = req.query; // e.g., /product/123?minStock=10

    // Mock database call
    const product = { id: id, name: 'Super Widget', stock: '5' }; // Bug: stock is a string

    // This comparison will not work as expected because '5' > 10 is false in string comparison
    if (product.stock > minStock) {
        res.json({ status: 'In Stock', details: product });
    } else {
        res.json({ status: 'Low Stock', details: product });
    }
});

app.listen(PORT, () => {
    console.log(`Server running on http://localhost:${PORT}`);
    console.log('Run with "node --inspect server.js" to enable debugging.');
});
To debug this:
- Run the server from your terminal:
node --inspect server.js. - Open Chrome and navigate to
chrome://inspect. - You will see your Node.js application listed. Click “inspect” to open a dedicated DevTools window.
- In the new DevTools window, navigate to the Sources tab, find
server.js, and place a breakpoint on the lineif (product.stock > minStock). - Make a request to
http://localhost:3000/product/123?minStock=10. - Execution will pause at your breakpoint. You can now hover over
product.stockandminStockto see their values and types, immediately revealing that one is a string and the other is not, which is the root cause of the bug.
Advanced Techniques and the New Frontier of AI Evals
For complex systems, simple bug fixing is not enough. We need advanced techniques for diagnosing performance issues, memory leaks, and the non-deterministic behavior of modern AI systems.
Performance and Memory Debugging
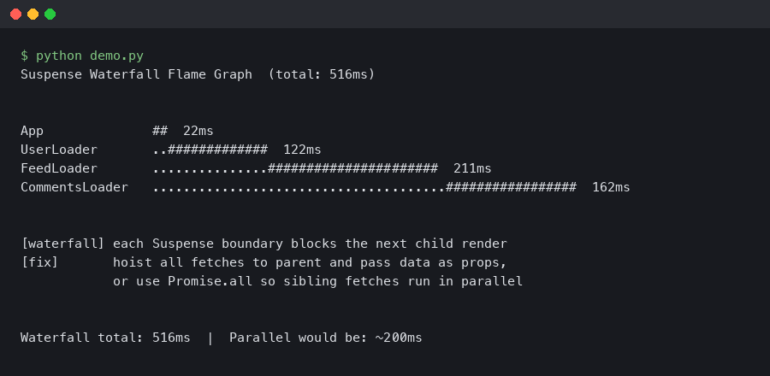
A “bug” can also be an application that is too slow or consumes too much memory. This is where profiling comes in. Profiling tools analyze your application’s performance and resource consumption to identify bottlenecks.

- Performance Profiling: Tools like Python’s built-in
cProfilemodule or the Performance tab in Chrome DevTools can record function call times, helping you identify which parts of your code are taking the most time to execute. - Memory Debugging: Memory leaks, where unused memory is not released, can crash an application over time. The Memory tab in Chrome DevTools allows you to take heap snapshots to analyze memory allocation, while tools like Python’s
memory-profilercan track memory usage on a per-line basis.
The Paradigm Shift: “Debugging” AI and LLMs with Evals
When working with Large Language Models (LLMs) and other generative AI, the concept of a “bug” changes dramatically. The problem is rarely a syntax error or a crash. Instead, it’s a “bad” output: a summary that misses the point, a chatbot response that is factually incorrect, or generated code that is insecure. You can’t set a breakpoint inside a neural network to see why it made a specific probabilistic choice.
This is where traditional debugging fails and the practice of LLM Testing, or “Evals” (Evaluations), becomes the key. An eval is a systematic way of measuring the quality of a model’s output against a set of predefined criteria. It’s how you “debug” the behavior of a black box.
An eval framework typically involves:
- A dataset of representative inputs (e.g., a list of articles to summarize).
- A set of quality metrics (e.g., factual accuracy, conciseness, tone, lack of harmful content).
- An evaluation function that scores the model’s output against these metrics. This can be done programmatically, by another powerful LLM (e.g., using GPT-4 to score a GPT-3.5 output), or with human review.
Here is a conceptual Python code example of a simple evaluation for a text summarization task.
import openai

# Assume openai.api_key is configured

def get_llm_summary(text):
    """A mock function to get a summary from an LLM."""
    # In a real application, this would be a call to an LLM API
    # For this example, we'll return a hardcoded, flawed summary
    print("--- Generating LLM Summary ---")
    # This summary incorrectly states the mission succeeded.
    return "The Apollo 13 mission was a great success, landing humans on the moon."

def evaluate_summary(original_text, summary):
    """
    Evaluates a summary based on predefined criteria using another LLM as a judge.
    """
    print("--- Evaluating Summary ---")

    # We use a more powerful model (like GPT-4) to act as the evaluator
    eval_prompt = f"""
    Original Text: "{original_text}"
    Generated Summary: "{summary}"

    Please evaluate the summary based on the following criteria.
    For each criterion, respond with only 'Yes' or 'No'.
    1. Factual Accuracy: Is the summary factually correct according to the original text?
    2. Conciseness: Is the summary significantly shorter than the original text?
    """

    # In a real scenario, you'd make an API call here.
    # We'll simulate the evaluator's response.
    eval_response = "1. Factual Accuracy: No\n2. Conciseness: Yes"
    print(f"Evaluator Response:\n{eval_response}")

    # Parse the response to get scores
    scores = {}
    for line in eval_response.split('\n'):
        parts = line.split(': ')
        if len(parts) == 2:
            key = parts[0].split('. ')[1].strip()
            value = parts[1].strip()
            scores[key] = (value == 'Yes')

    return scores

# --- Main Execution ---
article = "Apollo 13 was the seventh crewed mission in the Apollo space program and the third meant to land on the Moon. The craft was launched from Kennedy Space Center on April 11, 1970, but the lunar landing was aborted after an oxygen tank in the service module failed two days into the mission."

generated_summary = get_llm_summary(article)
evaluation_results = evaluate_summary(article, generated_summary)

print("\n--- Evaluation Results ---")
for criterion, result in evaluation_results.items():
    print(f"{criterion}: {'Pass' if result else 'Fail'}")

# The output will show a failure in "Factual Accuracy", pinpointing the problem.
# The "bug fix" isn't changing code, but likely improving the prompt or fine-tuning the model.
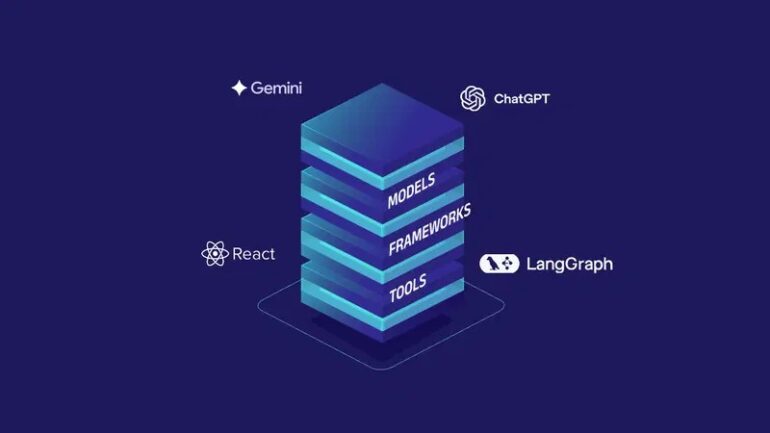
This evaluative approach is the future of Testing and Debugging for AI. The “fix” is often not in the code but in the data, the prompts, or the model architecture itself. Frameworks like LangChain, and platforms like LangSmith or Arize AI, are being built specifically to facilitate this new kind of debugging workflow.
Establishing a Robust Debugging Culture: Best Practices
Tools and techniques are only part of the solution. Building high-quality software requires a proactive culture focused on preventing bugs and minimizing their impact.
Proactive vs. Reactive Debugging
The easiest bug to fix is the one that never reaches production. A proactive approach includes:
- Comprehensive Testing: Writing thorough unit, integration, and end-to-end tests is non-negotiable. Debugging a small, failing unit test is infinitely faster than debugging a complex issue reported by a user.
- Static Analysis and Linting: Integrate tools like ESLint for JavaScript/TypeScript and Pylint/MyPy for Python into your development workflow. They catch a wide range of potential errors, from syntax mistakes to logical flaws, before you even run the code.
- CI/CD Automation: Automate your tests and static analysis within your Continuous Integration/Continuous Deployment (CI/CD) pipeline. This ensures that no code that fails basic quality checks can be merged or deployed.
Production Debugging and Monitoring
Despite best efforts, some bugs will make it to production. The key is to detect and diagnose them quickly.
- Error Tracking: Use services like Sentry, Bugsnag, or Rollbar. These tools automatically capture unhandled exceptions in your application, group them, and provide you with rich context like stack traces, browser/OS versions, and user actions leading up to the error.
- Application Performance Monitoring (APM): Tools like New Relic and Datadog provide deep insights into your production environment, monitoring everything from server response times and database queries to CPU usage. They help you spot anomalies and performance degradations in real-time.
Conclusion
Software debugging is a craft that evolves alongside the technology we build. The journey from painstakingly inserting print statements to leveraging interactive debuggers, and now to designing sophisticated evaluation frameworks for AI, reflects the increasing complexity of our digital world. The core principles, however, remain the same: a systematic approach, a deep curiosity about how systems work, and a commitment to quality.
The key takeaway is that a modern developer’s debugging toolkit must be diverse. It must include mastery of traditional tools like loggers and debuggers for deterministic code, as well as an understanding of the new, evaluative mindset required to build reliable AI-powered applications. By embracing both, and by fostering a proactive culture of quality through robust testing and monitoring, we can confidently build the resilient, intelligent, and dependable software of the future.