In the modern era of software engineering, the complexity of applications has exploded. We have moved from monolithic architectures to distributed microservices, polyglot environments, and containerized deployments. Consequently, the art of Software Debugging has had to evolve significantly. It is no longer sufficient to rely solely on scattered print statements or simple browser alerts. Today, developers require robust Debugging Frameworks that encompass the entire lifecycle—from local hot-reloading to Production Debugging inside Kubernetes clusters.
A comprehensive debugging strategy integrates Developer Tools, IDE protocols, and runtime inspectors into a cohesive workflow. Whether you are tackling Python Debugging in a backend API or React Debugging on the frontend, understanding the underlying frameworks that power these experiences is crucial. This article delves deep into the architecture of modern debugging, exploring how to configure environments for seamless Code Debugging, manage Docker Debugging workflows, and handle the complexities of Async Debugging in distributed systems.
Core Concepts: The Evolution of Debugging Frameworks
At the heart of modern Application Debugging lies the separation of the debugging UI (like VS Code or IntelliJ) from the debugging backend (the language runtime). This is largely standardized by the Debug Adapter Protocol (DAP). Before DAP, every IDE needed a custom plugin for every language. Now, a single protocol allows VS Code Debugging to interact seamlessly with Python, Node.js, Go, and more.
Local Run, Restore, and Hot Reload
The foundation of a rapid development loop is the ability to run locally with immediate feedback. Modern frameworks prioritize “Hot Reload” or “Live Reload,” where changes in the code are immediately reflected in the running application without a full restart. This is critical for JavaScript Development and Python Development alike.
However, to debug effectively, the environment must be “restored” correctly—dependencies must be synchronized (e.g., via uv sync in Python or npm install in Node). A robust debugging framework automates this setup. Below is an example of a sophisticated VS Code Debugging configuration (launch.json) for a Python application that enables debugging while respecting virtual environments.
{
    "version": "0.2.0",
    "configurations": [
        {
            "name": "Python: FastAPI with Hot Reload",
            "type": "python",
            "request": "launch",
            "module": "uvicorn",
            "args": [
                "main:app",
                "--reload",
                "--port",
                "8000"
            ],
            "jinja": true,
            "justMyCode": true,
            "env": {
                "PYTHONPATH": "${workspaceFolder}",
                "ENV_TYPE": "development"
            }
        }
    ]
}
In this configuration, we aren’t just running a script; we are invoking a module (uvicorn) with arguments that enable hot reloading. The justMyCode flag is a vital Debugging Tip: it prevents the debugger from stepping into internal library code, keeping the focus on your logic. This setup bridges the gap between Web Development Tools and backend logic, allowing for real-time API Debugging.
Implementation: Containerization and Remote Debugging
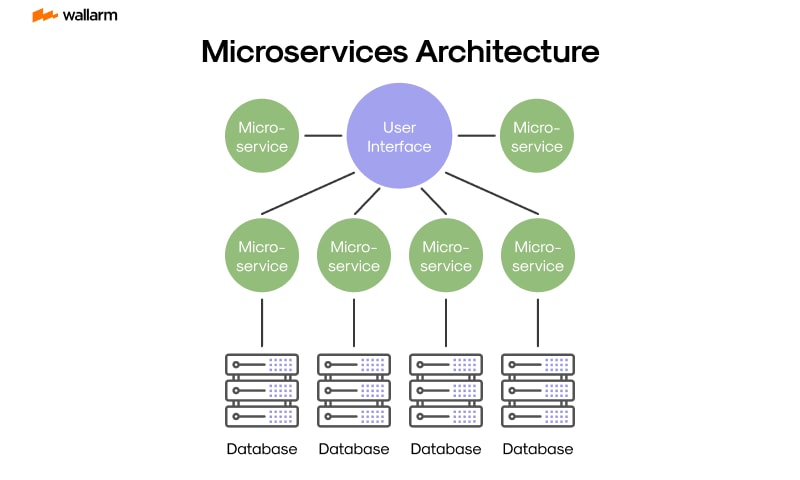
As applications scale, they often move into containers. Docker Debugging introduces a layer of complexity because the code is running in an isolated environment, separate from your IDE. A common pitfall in Full Stack Debugging is failing to expose the correct debugging ports or mapping source files correctly between the host and the container.
Auto-Generating Docker Assets for Debugging
Modern orchestration tools are increasingly capable of auto-generating Dockerfiles for publish and deploy scenarios. However, for debugging, you often need a specific “development” Dockerfile that installs debuggers (like debugpy for Python or enabling the inspector in Node.js).

To perform Node.js Debugging inside a container, you must expose the WebSocket port used by the V8 inspector. Here is how you structure a Docker setup to allow an external debugger to attach. This is essential for Microservices Debugging where running everything on “localhost” without containers is impossible.
# Dockerfile.dev
FROM node:18-alpine

WORKDIR /app

# Install dependencies first for caching
COPY package*.json ./
RUN npm install

# Copy source code
COPY . .

# Expose the application port AND the debug port
EXPOSE 3000 9229

# Start with the inspect flag
# --inspect=0.0.0.0:9229 allows connections from outside the container
CMD ["node", "--inspect=0.0.0.0:9229", "src/index.js"]
Once the container is running, you need a corresponding “Attach” configuration in your IDE. This is a critical Debugging Technique: shifting from “Launch” (IDE starts the app) to “Attach” (App is already running, IDE connects to it). This approach is language-agnostic, applying equally to Java Debugging or Go Debugging.
{
    "version": "0.2.0",
    "configurations": [
        {
            "name": "Docker: Attach to Node",
            "type": "node",
            "request": "attach",
            "port": 9229,
            "address": "localhost",
            "localRoot": "${workspaceFolder}",
            "remoteRoot": "/app",
            "restart": true
        }
    ]
}
The localRoot and remoteRoot mapping is the magic that allows VS Code to map the breakpoints you set in your UI to the actual files executing inside the Linux container. Without this, Remote Debugging fails, and breakpoints turn grey (unverified).
Advanced Techniques: Async Flows and Observability
System Debugging becomes significantly harder when dealing with asynchronous code. In JavaScript Debugging, “Callback Hell” has been replaced by Promises and Async/Await, but tracking the execution context across await boundaries remains tricky. Similarly, in Python Debugging with asyncio, stack traces can sometimes be truncated or confusing.
Handling Async Context and Stack Traces
When an error occurs in an asynchronous workflow, standard Stack Traces might only show the event loop execution rather than the chain of calls that led to the error. Advanced Debug Libraries and frameworks provide mechanisms to preserve this context.
Below is a Python example using asyncio where we implement a custom exception handler to aid in Backend Debugging. This pattern is essential when building robust APIs with frameworks like FastAPI or Django.
import asyncio
import logging
import sys

# Configure logging to capture debug info
logging.basicConfig(
    level=logging.DEBUG,
    format='%(asctime)s - %(name)s - %(levelname)s - %(message)s',
    stream=sys.stdout
)
logger = logging.getLogger("AsyncDebugger")

def handle_exception(loop, context):
    # Custom exception handler for the async loop
    msg = context.get("exception", context["message"])
    logger.error(f"Caught exception: {msg}")
    logger.error(f"Context: {context}")

    # Critical for debugging: Print the full stack if available
    if "exception" in context:
        import traceback
        traceback.print_tb(context["exception"].__traceback__)

async def faulty_microservice_call():
    logger.debug("Simulating network call...")
    await asyncio.sleep(1)
    # Simulate a crash
    raise ConnectionError("Service unavailable")

async def main():
    loop = asyncio.get_running_loop()
    loop.set_exception_handler(handle_exception)

    task = asyncio.create_task(faulty_microservice_call())

    try:
        await task
    except Exception:
        # This catch block might be bypassed if the task fails silently
        # without proper await or if using fire-and-forget patterns
        logger.info("Exception caught in main await")

if __name__ == "__main__":
    asyncio.run(main())
This code demonstrates Error Tracking within an event loop. By setting a custom exception handler, we catch errors that might otherwise result in “Task was destroyed but it is pending!” warnings, which are notorious in Python Development.
Frontend Integration: React and Error Boundaries
For Frontend Debugging, specifically React Debugging, the browser’s Debug Console is powerful, but application resilience requires catching errors before they crash the entire DOM tree. React Error Boundaries act as a declarative Debugging Framework within the UI itself.
import React from 'react';

class DebugErrorBoundary extends React.Component {
  constructor(props) {
    super(props);
    this.state = { hasError: false, error: null, errorInfo: null };
  }

  static getDerivedStateFromError(error) {
    return { hasError: true };
  }

  componentDidCatch(error, errorInfo) {
    // Log to an external Error Monitoring service
    console.group("React Error Boundary Caught:");
    console.error(error);
    console.error("Component Stack:", errorInfo.componentStack);
    console.groupEnd();
  }

  render() {
    if (this.state.hasError) {
      return (
        <div className="debug-overlay">
          <h2>Something went wrong.</h2>
          <details>
            <summary>Debug Trace</summary>
            {this.state.error && this.state.error.toString()}
            <br />
            {this.state.errorInfo && this.state.errorInfo.componentStack}
          </details>
        </div>
      );
    }

    return this.props.children;
  }
}

export default DebugErrorBoundary;
This component captures JavaScript Errors in its child tree, logs them (useful for Chrome DevTools analysis), and renders a fallback UI. This prevents the “White Screen of Death” and provides immediate visual feedback, a cornerstone of Debugging Best Practices.
![AI chatbot user interface - 7 Best Chatbot UI Design Examples for Website [+ Templates]](https://debuglab.net/wp-content/uploads/2025/12/inline_37365d80.jpg)
Best Practices and Optimization
Effective debugging is not just about tools; it is about methodology. Whether you are doing TypeScript Debugging or managing Kubernetes Debugging, the following practices ensure efficiency.
1. Logging vs. Debugging
Do not confuse Logging and Debugging. Logging provides a historical record of events (Observability), while debugging is an interactive process of inspection. In Production Debugging, you cannot attach a debugger. Therefore, you must rely on structured logging (JSON format) and Error Monitoring tools like Sentry or Datadog. Ensure your logs include correlation IDs to trace requests across Microservices Debugging boundaries.
2. Source Maps are Non-Negotiable
For Web Debugging and transpiled languages (TypeScript, Babel), Source Maps are critical. They map the minified, browser-ready code back to your original source. Without them, Chrome DevTools will show you obfuscated variable names, making Bug Fixing nearly impossible. Ensure your build pipeline (Webpack, Vite, or Parcel) generates these maps for development and staging environments.
3. Automated Debugging in CI/CD
![AI chatbot user interface - 7 Best Chatbot UI Design Examples for Website [+ Templates]](https://debuglab.net/wp-content/uploads/2025/12/inline_c39f3e5a-scaled.jpg)
CI/CD Debugging is often overlooked. When a build fails in the pipeline, you need artifacts. Configure your pipelines to save crash dumps, screenshots (for UI tests), and verbose logs. Tools that auto-generate Docker files for deployment should also be configured to produce “debug-ready” images for staging environments, allowing for Remote Debugging before a final production push.
4. Memory and Performance Profiling
Debugging isn’t just about fixing crashes; it’s about fixing bottlenecks. Debug Performance issues using Profiling Tools. In Node.js, use the --prof flag. In Python, use cProfile. Memory Debugging is essential for long-running processes; look for memory leaks by taking heap snapshots in your Developer Tools. A framework that supports hot reloading must be carefully monitored to ensure it doesn’t introduce memory leaks during the development session.
Conclusion
Mastering Debugging Frameworks is a journey that extends far beyond learning keyboard shortcuts in your IDE. It requires a deep understanding of how your application is orchestrated—from the local uv sync and hot-reload cycles to the generation of Docker containers for deployment. By leveraging the Debug Adapter Protocol, configuring robust launch.json files, and implementing structured error handling in both frontend and backend code, you transform debugging from a reactive chore into a proactive engineering discipline.
As you define your applications in different languages, remember that the fundamentals remain the same: visibility, control, and reproducibility. Start by auditing your current debugging setup. are you relying on console logs? Try setting up a remote debugger for your Docker containers today. Investigate your Static Analysis tools and ensure your Error Messages are verbose enough to tell a story. The better your debugging framework, the faster you can deliver high-quality software.


