Kubernetes has undeniably become the operating system of the cloud. It abstracts away the complexities of underlying hardware, allowing organizations to scale applications with unprecedented speed. However, this abstraction comes at a cost. When things go wrong, they often go wrong in complex, distributed ways that traditional monolithic debugging techniques cannot address. The shift from debugging a single server to debugging a dynamic cluster requires a fundamental change in mindset and tooling.
Debugging infrastructure at scale is rarely about discovering one singular error in a line of code. Instead, it is often a journey through layers of networking, resource constraints, configuration drifts, and race conditions. Whether you are dealing with Microservices Debugging, resolving Python Errors in a crashing pod, or investigating Network Debugging latency between nodes, the process requires a systematic approach to isolation and observability.
In this comprehensive guide, we will explore the depths of Kubernetes Debugging. We will move beyond basic kubectl logs and dive into advanced techniques for System Debugging, Performance Monitoring, and Production Debugging. We will cover how to handle application-specific issues—from Node.js Debugging to Java memory leaks—within a containerized environment, ensuring your infrastructure remains resilient and performant.
Section 1: The Pod Lifecycle and Container Diagnostics
The fundamental unit of Kubernetes is the Pod. When a service fails, the investigation almost always begins here. The two most notorious states a developer will encounter are CrashLoopBackOff and ImagePullBackOff. While the error messages seem descriptive, the root causes are often hidden behind Stack Traces or misconfigured environment variables.
Decoding CrashLoopBackOff
A CrashLoopBackOff implies that the application inside the container is starting, encountering a critical error, and exiting immediately. Kubernetes then tries to restart it, creating a loop. To solve this, you must treat it as a standard Code Debugging exercise but performed remotely.
If you are performing Python Debugging or Node.js Debugging, the application logs are your first source of truth. However, if the crash happens too quickly, logs might not flush to standard output in time. A best practice here is to override the container’s entry point to keep the container alive, allowing you to shell in and execute the code manually.
Below is an example of a Kubernetes deployment configured for debugging. We override the command to sleep, allowing us to enter the container and perform Application Debugging manually.
apiVersion: apps/v1
kind: Deployment
metadata:
  name: debug-python-app
spec:
  replicas: 1
  selector:
    matchLabels:
      app: python-backend
  template:
    metadata:
      labels:
        app: python-backend
    spec:
      containers:
      - name: python-container
        image: my-python-api:latest
        # OVERRIDE: Keep container running to debug startup errors
        command: ["/bin/sh", "-c", "sleep 3600"]
        env:
        - name: DEBUG_MODE
          value: "true"
        resources:
          limits:
            memory: "512Mi"
            cpu: "500m"
Once the pod is running (sleeping), you can execute into it. This is critical for Full Stack Debugging where environment variables or file permissions might be the culprit rather than the code syntax itself.
# Enter the pod
kubectl exec -it deployment/debug-python-app -- /bin/bash

# Inside the pod, run the app manually to see the stack trace
python3 app.py
Liveness and Readiness Probes
Another common source of “bad vibes” in a cluster is aggressive Liveness Probes. If your application takes 30 seconds to warm up (common in Java Development or complex Django Debugging scenarios), but Kubernetes checks for health after 5 seconds, the pod will be killed and restarted indefinitely. This isn’t a code bug; it’s a configuration bug.
Always align your initialDelaySeconds with the actual startup time of your application. Use Performance Monitoring tools to measure exactly how long your app takes to become ready.
Section 2: Networking, DNS, and Service Discovery
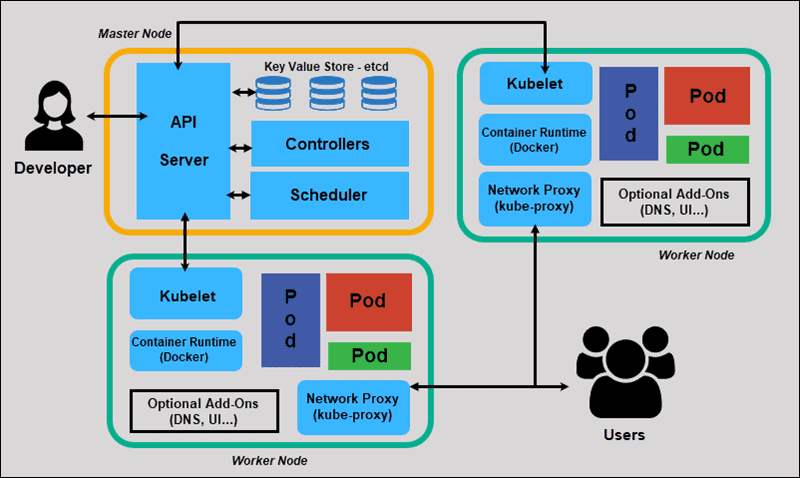
Network Debugging in Kubernetes is often described as a “hypercube” of complexity. You are dealing with Pod IPs, Service IPs (ClusterIP), Ingress Controllers, and CoreDNS. When Service A cannot talk to Service B, the issue could be anywhere in the chain.
The Ephemeral Debug Container
In modern Kubernetes versions, you shouldn’t install Debug Tools like curl, dig, or telnet into your production images. This bloats the image and introduces security risks. Instead, use ephemeral debug containers. This feature allows you to attach a “sidecar” containing all your favorite Web Development Tools to a running pod without restarting it.
This is particularly useful for API Debugging. If your frontend (React/Vue) cannot reach the backend, you can attach a debug container to the frontend pod and try to curl the backend service directly, bypassing the browser and Ingress to isolate the fault.
# Launch a debug container attached to a running pod
kubectl debug -it pod/frontend-app-7b89c --image=nicolaka/netshoot --target=frontend-container

# Once inside, use specialized network tools
# Test DNS resolution
dig backend-service.default.svc.cluster.local

# Test TCP connectivity
nc -zv backend-service 8080
The netshoot image used above is a gold standard in Docker Debugging and Kubernetes troubleshooting, containing tools for Network Debugging, latency checking, and packet capturing.
Ingress and CORS Issues
For Full Stack Debugging involving React Debugging or Angular Debugging, the issue often manifests as a CORS error in the Chrome DevTools console. While the browser reports a CORS error, the underlying issue in Kubernetes is often an Ingress controller stripping headers or an API Gateway returning a 500 error (which lacks CORS headers).
Don’t trust the browser error blindly. Check the Ingress logs. If you are using NGINX Ingress, increasing the log level can reveal if the request is being blocked before it even reaches your Node.js or Python application.
Section 3: Resource Management and Performance Profiling
Memory Debugging is a critical aspect of Kubernetes operations. The dreaded OOMKilled (Out of Memory) error occurs when a container tries to use more memory than its limit allows. This is common in Java applications (due to JVM heap settings) or Node.js Development where memory leaks accumulate over time.
Requests vs. Limits
A common pitfall is setting limits too close to requests. If your Python data processing worker spikes in memory usage, Kubernetes will kill it instantly if it hits the limit. Debugging this requires Profiling Tools. You need to visualize the memory usage over time using Prometheus or Grafana.
Here is a Python script example that simulates a memory leak, which is useful for testing your Error Monitoring and alerting systems. We will also look at how to catch this using Static Analysis of your YAML files before deployment.
import time
import os

# Simulating a memory leak for Debugging purposes
data_store = []

def memory_hog():
    print(f"Process ID: {os.getpid()}")
    print("Starting memory consumption...")

    while True:
        # Append 10MB of data every second
        data_store.append(' ' * 10 * 1024 * 1024)
        print(f"Current list size: {len(data_store)} blocks (approx {len(data_store)*10} MB)")

        # Sleep to allow monitoring tools to catch the spike
        time.sleep(1)

if __name__ == "__main__":
    try:
        memory_hog()
    except MemoryError:
        # In a real scenario, this might not catch if the Kernel OOM killer strikes first
        print("Caught MemoryError! Cleaning up...")
When debugging Docker Debugging issues related to memory, remember that the container runtime (Docker/containerd) sees the host’s total memory, but the container is constrained by cgroups. Languages like Java (pre-Java 10) and Node.js sometimes fail to respect these cgroup limits unless explicitly configured, leading to immediate crashes.
Node Pressure and Eviction
Sometimes the pod is fine, but the Node is in trouble. System Debugging requires checking kubectl describe node <node-name>. If the node is under “DiskPressure” or “MemoryPressure,” Kubernetes will start evicting pods. This often looks like random application failures but is actually the scheduler doing its job to save the node.
Section 4: Advanced Observability and Remote Debugging
In a microservices architecture, a single user request might traverse ten different services. Logging and Debugging via kubectl logs is insufficient here because you lose the context of the request flow. You need distributed tracing and centralized logging.
Remote Debugging with Telepresence
One of the most powerful techniques for Microservices Debugging is the ability to swap a remote cluster service with a local process on your laptop. Tools like Telepresence allow you to “intercept” traffic destined for a service in the cluster and route it to your local machine.
This allows you to use your IDE’s debugger (VS Code, IntelliJ) with full breakpoints on live traffic. This bridges the gap between Local Development and Production Debugging. You can debug a TypeScript service locally while it talks to a remote Redis and Postgres database inside the cluster.
Structured Logging for Better Querying
To make Error Tracking effective, stop writing plain text logs. Use structured JSON logging. This allows log aggregators (like Elasticsearch or Loki) to index fields like user_id, request_id, or error_code. This is vital for Backend Debugging.
Here is an example of configuring a Node.js application (using Winston) to output logs that are Kubernetes-friendly. This format aids significantly in Automated Debugging workflows.
const winston = require('winston');

const logger = winston.createLogger({
  level: 'info',
  // Use JSON format for easier parsing in ELK/Loki
  format: winston.format.combine(
    winston.format.timestamp(),
    winston.format.json()
  ),
  defaultMeta: { service: 'user-service', env: process.env.NODE_ENV },
  transports: [
    new winston.transports.Console()
  ],
});

// Example usage in an Express route
// This helps in API Debugging by correlating requests
app.get('/api/users/:id', (req, res) => {
    logger.info('Fetching user data', {
        requestId: req.headers['x-request-id'],
        userId: req.params.id
    });

    // Simulate error
    try {
        throw new Error("Database connection failed");
    } catch (error) {
        logger.error('Failed to fetch user', {
            requestId: req.headers['x-request-id'],
            error: error.message,
            stack: error.stack
        });
        res.status(500).send({ error: "Internal Server Error" });
    }
});
Best Practices and Optimization
To master Kubernetes Debugging, you must move from reactive fixing to proactive prevention. Here are key best practices to optimize your debugging workflow:
- Implement Correlation IDs: Ensure every request entering your Ingress gets a unique ID that is propagated to all downstream services. This makes Microservices Debugging possible by tracing a single transaction across logs.
- Use Static Analysis: Tools like
kubevalordatreecan validate your Kubernetes manifests against best practices before they are applied. This prevents CI/CD Debugging headaches caused by typos in YAML. - Health Check Strategy: Differentiate between Liveness (restart me) and Readiness (don’t send me traffic). Misconfigured probes are the #1 cause of “ghost” restarts.
- Debugging Automation: Automate the collection of debug data. When a pod crashes, use a hook to dump the memory state or grab the last 100 lines of logs and send them to Slack.
- Security in Debugging: Never leave debug ports (like Java JDWP or Node.js inspector) open in production. Use port forwarding (
kubectl port-forward) only when necessary and secure your Developer Tools.
Conclusion
Debugging Kubernetes is a discipline that combines systems engineering, network analysis, and application logic. It requires looking beyond the code to understand the environment in which the code executes. By mastering the pod lifecycle, utilizing ephemeral containers for Network Debugging, and implementing robust observability standards, you can turn the “hypercube of bad vibes” into a manageable, transparent infrastructure.
Remember that the goal of Software Debugging in a distributed system is not just to fix the bug, but to improve the system’s resilience against future failures. Start incorporating these tools and techniques into your daily workflow, and you will find that even the most obscure infrastructure issues become solvable puzzles rather than insurmountable walls.


