Mastering Flask Debugging: From Built-in Tools to Advanced IDE Integration
Developing web applications with Python’s Flask framework is often a streamlined and enjoyable experience. However, even the most seasoned developers can hit a wall when it comes to debugging. One of the most common and frustrating scenarios is setting a breakpoint in your favorite IDE, like Visual Studio Code, only to watch your application run right past it, completely ignoring your attempt to pause execution. This experience can leave you questioning your setup, your tools, and sometimes, your sanity.
The truth is, this issue isn’t a bug in Flask or your IDE; it’s a fundamental conflict in how different debugging tools operate. Flask’s built-in development server comes with powerful features designed to accelerate development, but these very features can interfere with external debuggers. This comprehensive guide will demystify the world of Flask Debugging. We will explore Flask’s native debugging capabilities, uncover why they conflict with IDEs, provide a rock-solid configuration for seamless debugging in VS Code, and delve into advanced techniques like logging, profiling, and remote debugging. By the end, you’ll have a robust toolkit for efficient bug fixing and a deeper understanding of the entire Python debugging ecosystem.
Understanding Flask’s Built-in Debugging Tools
Before we tackle external tools, it’s crucial to understand what Flask offers out of the box. When you start a Flask development server, you’re interacting with a WSGI server provided by the Werkzeug library, which includes a suite of helpful debugging utilities.
The Development Server and Debug Mode
The simplest way to enable Flask’s debugging features is by setting the debug flag to True when you run your application. This single change activates two powerful components: the interactive debugger and the automatic reloader.
You can enable it directly in your code:
from flask import Flask

app = Flask(__name__)

@app.route('/')
def hello_world():
    # This line will cause an error
    result = 1 / 0
    return 'Hello, World!'

if __name__ == '__main__':
    # Running in debug mode
    app.run(debug=True)
Alternatively, and more commonly, you can control this with environment variables, which is considered a best practice:
$ export FLASK_APP=your_app.py$ export FLASK_ENV=development$ flask run
When FLASK_ENV is set to development, debug mode is automatically enabled.
The Werkzeug Interactive Debugger
The star of Flask’s built-in toolset is the Werkzeug interactive debugger. When your application is in debug mode and encounters an unhandled exception, it doesn’t just crash. Instead, it presents a detailed, interactive traceback directly in your browser. This interface is a goldmine for backend debugging.
With this tool, you can:
- View the complete stack trace to see the exact sequence of calls that led to the error.
- Inspect the local variables for each frame in the stack, allowing you to see the state of your application at the moment the error occurred.
- Open an interactive Python console for any frame, letting you execute code in that context to test hypotheses or further investigate variables.
This in-browser debug console is incredibly powerful for quickly diagnosing Python errors without ever leaving your web browser.
The Automatic Reloader
The second component enabled by debug mode is the reloader. It monitors your project files for changes. As soon as you save a file, the reloader automatically restarts the server, applying your changes instantly. This creates a fast feedback loop, which is essential for productive web development. However, as we’ll see, this convenience is the primary source of conflict with external debuggers.
Integrating Flask with IDEs: Solving the Breakpoint Problem
While the Werkzeug debugger is excellent for post-mortem analysis of exceptions, it doesn’t allow you to proactively pause your code at a specific line. For that, we need an IDE debugger with breakpoints. This is where many developers encounter issues.
The Core Conflict: Reloader vs. IDE Debugger
When you set a breakpoint in VS Code or PyCharm and start a debugging session, the IDE attaches its debugger to the Python process. The problem is that the Flask reloader works by starting your application in a parent process that watches for file changes. When it’s ready to serve requests, it spawns a child process where your actual Flask code runs.
Your IDE’s debugger is attached to the parent process, but the breakpoint is in the code running in the child process. The debugger in the parent process never sees the execution reach your breakpoint, so it’s never triggered. This is a classic problem in application debugging where process management interferes with debugging tools.
The solution is to tell Flask not to use its built-in debugger and reloader, allowing your IDE’s debugger to take full control of the single process running your code.
Configuring VS Code for Flawless Flask Debugging
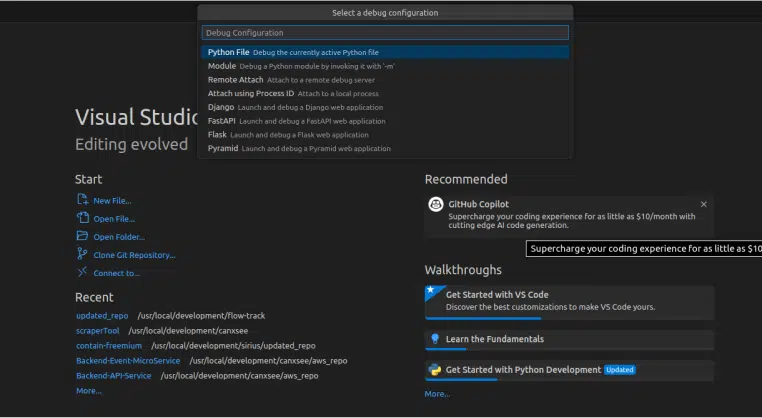
To achieve a seamless debugging experience in VS Code, you need to create a launch configuration file (.vscode/launch.json) that instructs the IDE on how to run your Flask application correctly for debugging.
Here is a template for your launch.json file:
{
    "version": "0.2.0",
    "configurations": [
        {
            "name": "Python: Flask",
            "type": "python",
            "request": "launch",
            "module": "flask",
            "env": {
                "FLASK_APP": "app.py", // Your main application file
                "FLASK_ENV": "development"
            },
            "args": [
                "run",
                "--no-debugger",
                "--no-reload"
            ],
            "jinja": true,
            "justMyCode": true
        }
    ]
}
Let’s break down the key settings:
"module": "flask": This tells VS Code to run Flask as a module (equivalent topython -m flask), which is the recommended way."env": Sets necessary environment variables.FLASK_APPpoints to your application’s entry point."args": This is the most critical part. We pass arguments to theflask runcommand."--no-debugger": Disables the Werkzeug interactive debugger."--no-reload": Disables the automatic reloader and its multi-process behavior.
With this configuration, when you start a debugging session in VS Code (by pressing F5), it will launch a single Flask process. The VS Code debugger will attach correctly, and your breakpoints will now work as expected. This approach provides one of the most effective debugging techniques for modern Python web development.
Advanced Flask Debugging Techniques
Once you’ve mastered breakpoints, you can expand your debugging tools repertoire with more advanced methods for gaining insight into your application’s behavior, from development to production.
Effective Logging for Deeper Insights
While print() statements are tempting for quick checks, they are a poor substitute for a robust logging strategy. Logging provides context, severity levels, timestamps, and can be easily configured to write to the console, files, or external error tracking services.
Flask is built on standard Python logging. You can easily configure it to get more detailed output.
import logging
from logging.handlers import RotatingFileHandler
from flask import Flask, request

app = Flask(__name__)

# Configure structured logging
if not app.debug:
    handler = RotatingFileHandler('app.log', maxBytes=10000, backupCount=3)
    handler.setLevel(logging.INFO)
    formatter = logging.Formatter(
        '%(asctime)s %(levelname)s: %(message)s [in %(pathname)s:%(lineno)d]'
    )
    handler.setFormatter(formatter)
    app.logger.addHandler(handler)
    app.logger.setLevel(logging.INFO)

@app.route('/')
def index():
    user_ip = request.remote_addr
    app.logger.info(f'Index page accessed by user at IP: {user_ip}')
    return 'Welcome to the logged application!'

@app.route('/error')
def trigger_error():
    try:
        result = 1 / 0
    except ZeroDivisionError:
        app.logger.error('A ZeroDivisionError occurred!', exc_info=True)
        return "An error occurred, check the logs.", 500
    return "This should not be reached."

if __name__ == '__main__':
    app.run(debug=True)
This setup provides structured logs that are far more useful than simple print statements, especially for API debugging and tracking request flows. The exc_info=True argument automatically includes the full stack trace in your error logs.
Remote and Docker Debugging
What if your Flask application is running inside a Docker container or on a remote server? You can’t just attach a local IDE debugger. This is where remote debugging comes in. The debugpy library (maintained by Microsoft) is the standard for this in the Python world.
First, install it: pip install debugpy.
Next, add a few lines to your application’s entry point to start the debugpy server:
import debugpy
from flask import Flask

# Start the debugpy listener
debugpy.listen(("0.0.0.0", 5678))
print("Debugger is listening on port 5678...")

# Optional: uncomment the line below to make the app wait until a debugger attaches
# debugpy.wait_for_client()

app = Flask(__name__)

@app.route('/')
def home():
    # Set a breakpoint here in your IDE
    message = "Hello from a remotely debugged Flask app!"
    print(message)
    return message

if __name__ == '__main__':
    # Important: Do NOT use the Flask reloader or debugger here
    app.run(host='0.0.0.0', port=5000, debug=False)
You would then add a new “Attach” configuration to your VS Code launch.json to connect to the listening process. This is an essential technique for Docker debugging and diagnosing issues in staging or testing environments that mimic production.
Best Practices and Common Pitfalls
A successful debugging framework relies on good habits and awareness of common mistakes. Here are some best practices and pitfalls to keep in mind for effective Flask debugging.
Debugging Best Practices
- Use the Right Tool for the Job: Use Flask’s built-in debugger (`debug=True`) for quick, initial development and analyzing crashes. Switch to an IDE debugger with `–no-reload` for complex logic and setting breakpoints.
- Embrace Structured Logging: Integrate logging early in your development process. It’s invaluable for both development debugging and production debugging.
- Separate Configuration: Use environment variables (e.g., via
.envfiles) to manage yourFLASK_ENVand other settings. This prevents you from accidentally committing debug configurations. - NEVER Run in Debug Mode in Production: This is the most critical rule. Running with
debug=Truein a production environment is a massive security vulnerability. The Werkzeug debugger allows the execution of arbitrary Python code, which could give an attacker complete control over your server.
Common Pitfalls to Avoid
- The Reloader Trap: Forgetting to disable the reloader when using an IDE debugger is the #1 cause of non-working breakpoints.
- Environment Variable Mismatch: Ensure your
FLASK_APPenvironment variable correctly points to your application instance. - Firewall and Port Issues: When remote debugging, ensure that the port (e.g., 5678 for
debugpy) is not blocked by a firewall on the host machine or by networking rules in your Docker or cloud environment. - Ignoring Stack Traces: Don’t be intimidated by long error messages. Take the time to read the stack trace from the bottom up. It tells a story about what your code was doing right before the error occurred.
Conclusion
Effective software debugging is a skill that separates good developers from great ones. In the context of Flask, this means understanding the tools at your disposal and, more importantly, knowing when and how to use them. We’ve seen that Flask’s built-in debugger is a fantastic tool for rapid feedback but that its reloader can conflict with the powerful breakpoint-based debugging offered by modern IDEs.
By mastering the simple but crucial configuration of disabling the built-in reloader and debugger for your IDE sessions, you unlock a smooth, efficient, and frustration-free workflow. When you combine this with advanced techniques like structured logging and remote debugging, you are well-equipped to tackle any bug, from a simple typo to a complex issue in a containerized environment. Adopt these practices, build your debugging muscle, and spend less time fixing bugs and more time building amazing applications.