In the fast-paced world of software development, the traditional debugging cycle often feels like a bottleneck. Developers write code, push it to a testing environment, and wait for QA teams or automated tests to uncover bugs. This reactive process is time-consuming, expensive, and a major drain on developer productivity. However, a paradigm shift is underway, driven by the convergence of two powerful concepts: “shift-left” methodologies and Artificial Intelligence. By moving debugging activities earlier into the development lifecycle—a practice known as shifting left—and augmenting them with intelligent tools, we are entering a new era of proactive quality assurance.
This article explores the transformative impact of AI on modern developer tools and debugging techniques. We will delve into how AI-powered code analysis is not just finding bugs earlier but is also providing actionable solutions, from specific code patches to deep root cause analysis. By integrating these intelligent systems directly into the developer’s workflow, teams can catch errors before they are ever merged, drastically reducing bug-fixing time and building more robust, reliable software from the ground up.
Understanding the Shift-Left Revolution in Debugging
The core principle of “shifting left” is simple yet profound: integrate quality assurance and testing practices at the earliest possible stages of the Software Development Lifecycle (SDLC). Instead of treating debugging as a separate, later-stage activity, it becomes an intrinsic part of the coding process itself.
What is “Shift-Left” Debugging?
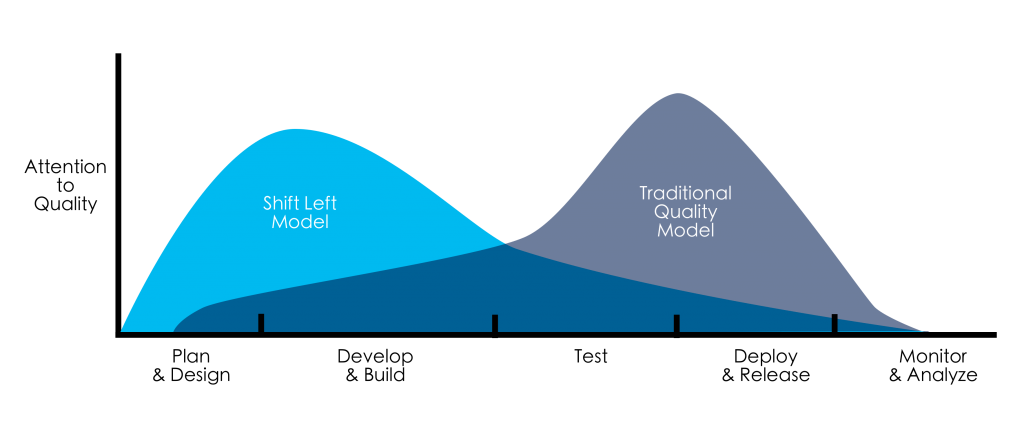
Traditionally, the SDLC is visualized as a linear progression from left (requirements, design, coding) to right (testing, deployment, maintenance). Debugging historically sat firmly on the right side. A developer would commit code, and only after it was integrated and deployed to a staging environment would comprehensive testing begin. Shift-left debugging flips this model. It advocates for continuous testing and validation as the code is being written and before it’s merged into the main branch. This approach creates a rapid feedback loop, allowing developers to identify and fix issues in real-time, when the context is still fresh in their minds. The benefits are clear: reduced costs associated with fixing bugs late in the cycle, accelerated delivery timelines, and a significant improvement in overall code quality and application security.
The Role of AI in Modern Code Analysis
While static and dynamic analysis tools have been part of the developer’s toolkit for years, AI introduces a new level of sophistication. Traditional Static Application Security Testing (SAST) tools work by matching code against a predefined set of rules and patterns. They are effective but often suffer from a high rate of false positives and can miss nuanced, context-dependent bugs. AI-powered code analysis tools, on the other hand, leverage machine learning models trained on vast datasets of open-source and proprietary code. This allows them to understand the *intent* and *context* of the code, not just its syntax.
For example, consider a common Python pitfall: using a mutable default argument. A simple linter might not flag this, but an AI tool that understands the language’s runtime behavior will recognize the potential for unintended side effects.
# A subtle bug a traditional linter might miss
def add_to_list(item, target_list=[]):
    """
    This function has a bug related to mutable default arguments.
    The list is initialized only once, leading to shared state
    across function calls.
    """
    target_list.append(item)
    return target_list

# Expected behavior might be two separate lists
list_one = add_to_list(1)
print(f"List one: {list_one}") # Output: List one: [1]

list_two = add_to_list(2)
print(f"List two: {list_two}") # Unexpected Output: List two: [1, 2]

# An AI tool would recognize this pattern and suggest a fix:
def add_to_list_fixed(item, target_list=None):
    """
    Correct implementation using a sentinel value.
    A new list is created if one isn't provided.
    """
    if target_list is None:
        target_list = []
    target_list.append(item)
    return target_list
In this scenario, an AI-powered tool would not only flag the problematic line but also explain *why* it’s an issue (shared state due to single-time initialization of default arguments) and provide the corrected code as a suggested patch. This elevates the tool from a simple bug finder to a genuine coding assistant, enhancing both code quality and developer education.
Integrating AI into the Development Workflow
The true power of AI-driven debugging is realized when it’s seamlessly integrated into the daily routines of developers. The goal is to make proactive code analysis an invisible, frictionless part of the development process, providing feedback directly within the tools developers already use, such as their IDE and CI/CD pipelines.

Automated Code Scanning in CI/CD Pipelines
The most effective place to enforce quality gates is within the Continuous Integration/Continuous Deployment (CI/CD) pipeline. By adding an AI-powered analysis step to every pull request or merge request, you can automatically prevent buggy or insecure code from ever reaching the main branch. Tools like Snyk Code, GitHub Copilot Enterprise (with its code scanning capabilities), and SonarQube are designed for this purpose.
Integrating these tools is often as simple as adding a step to a workflow file. Here is an example of a GitHub Actions workflow that triggers an AI-powered security and quality scan on every push to a pull request.
name: AI-Powered Code Analysis

on:
  push:
    branches: [ main ]
  pull_request:
    branches: [ main ]

jobs:
  analyze:
    name: Analyze Codebase
    runs-on: ubuntu-latest

    steps:
    - name: Checkout repository
      uses: actions/checkout@v3

    # Example using Snyk Code for AI-powered security scanning
    # This step scans for vulnerabilities and provides contextual fixes.
    - name: Run Snyk to check for vulnerabilities
      uses: snyk/actions/node@master
      env:
        SNYK_TOKEN: ${{ secrets.SNYK_TOKEN }}
      with:
        command: code test
        args: --sarif-file-output=snyk.sarif

    # Upload results to GitHub's code scanning alerts
    - name: Upload SARIF file
      uses: github/codeql-action/upload-sarif@v2
      with:
        sarif_file: snyk.sarif
This automated check acts as a vigilant gatekeeper. If the AI scan detects critical issues, it can fail the build, blocking the merge and forcing the developer to address the problem. The report generated often links directly back to the problematic lines of code in the pull request, complete with explanations and suggested fixes.
From Bug Detection to Automated Patching
The next evolutionary step is moving beyond mere detection to automated remediation. Modern AI developer tools don’t just tell you what’s wrong; they show you how to fix it. This is a game-changer for developer productivity, transforming a potentially lengthy debugging session into a one-click fix.
Consider a common JavaScript error in a Node.js application where an asynchronous operation is not properly handled, leading to a potential unhandled promise rejection, a classic source of Node.js errors.
// --- BEFORE: Problematic Code ---
// This function fetches user data but doesn't handle potential errors.
// If the API call fails, it will result in an unhandled promise rejection.

const axios = require('axios');

async function getUserProfile(userId) {
  // The 'await' is missing, and there's no error handling.
  const response = axios.get(`https://api.example.com/users/${userId}`);

  // This line will execute before the promise resolves, causing issues.
  console.log('User data fetched.');
  return response.data;
}


// --- AFTER: AI-Suggested Patch ---
// The AI tool identifies the missing 'await' and lack of try...catch block.

async function getUserProfileFixed(userId) {
  try {
    // Correctly awaits the promise resolution.
    const response = await axios.get(`https://api.example.com/users/${userId}`);
    console.log('User data fetched successfully.');
    return response.data;
  } catch (error) {
    // Adds robust error handling for API failures.
    console.error(`Error fetching user profile for ID ${userId}:`, error.message);
    // Propagate the error or return a default state.
    throw error;
  }
}
An intelligent tool integrated into the IDE (like Visual Studio Code with GitHub Copilot) would highlight the problematic `getUserProfile` function. It would explain that the `axios.get` call returns a promise that is not being awaited and that there is no mechanism to handle network or API errors. It would then propose the `getUserProfileFixed` version as a direct, applicable patch, complete with a `try…catch` block for robust error handling. This immediate, contextual feedback loop is instrumental in preventing common JavaScript errors and improving backend debugging practices.
Advanced Techniques: Beyond Simple Bug Detection
The capabilities of AI in software debugging extend far beyond identifying syntax errors or common anti-patterns. Advanced systems are now capable of performing deep analysis to uncover the root cause of complex issues and even predict problems before they manifest.
AI-Driven Root Cause Analysis (RCA)
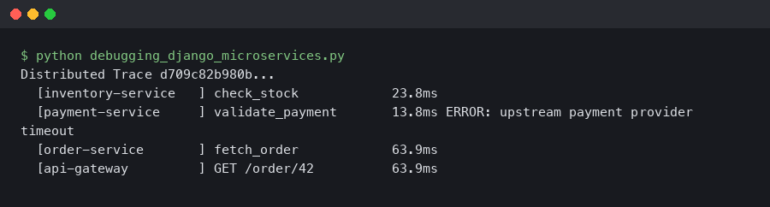
One of the most time-consuming aspects of debugging is Root Cause Analysis (RCA). When a critical error occurs in production, developers must sift through logs, stack traces, and monitoring dashboards to piece together the sequence of events that led to the failure. AI is revolutionizing this process by automating the analysis. Modern error tracking and observability platforms like Sentry, Datadog, and New Relic are increasingly integrating AI features that can correlate data from multiple sources. An AI-driven RCA system can:
- Analyze Stack Traces: Go beyond just showing the call stack by linking each frame to the exact version of the code that was running in production.
- Correlate Logs: Ingest structured logs surrounding the time of the error to identify anomalous patterns or specific log messages that preceded the crash.
- Connect to Code History: Integrate with Git to pinpoint the exact commit and pull request that likely introduced the bug, a practice known as “suspect commit” identification.
Instead of just an error message, a developer receives a rich, narrative report: “This null pointer exception in `payment-service` began after commit `a1b2c3d` was deployed. It is triggered when the `user.billingInfo` object is null, which has occurred 1,500 times in the last hour, primarily affecting users on iOS. The suspect commit modified the user authentication flow.” This level of automated insight reduces the mean time to resolution (MTTR) from hours to minutes.

Predictive Bug Analysis and Performance Profiling
The ultimate goal of shift-left is to be proactive rather than reactive. Predictive analysis is the frontier of this movement. By training machine learning models on a project’s entire history—including past bugs, code churn, and complexity metrics—AI tools can start to predict which new code changes are most likely to be risky. This allows teams to allocate additional testing and review resources to high-risk commits.
Furthermore, AI is making performance debugging more accessible. It can analyze code to spot notoriously difficult-to-find issues like N+1 query problems in ORMs (Object-Relational Mapping), memory leaks, and inefficient algorithmic complexity *before* the code is even run. For instance, in a Python web framework like Django or Flask, an AI profiler could detect a classic N+1 database query.
# models.py (Django example)
from django.db import models

class Author(models.Model):
    name = models.CharField(max_length=100)

class Book(models.Model):
    title = models.CharField(max_length=200)
    author = models.ForeignKey(Author, on_delete=models.CASCADE, related_name='books')

# views.py (N+1 Query Problem)
def list_books_inefficient(request):
    """
    This view triggers an N+1 query problem.
    1 query to fetch all books.
    N additional queries to fetch the author for each book.
    """
    books = Book.objects.all()
    # In a template, iterating over books and accessing book.author.name
    # would trigger a new DB query for every single book.
    for book in books:
        print(f'"{book.title}" by {book.author.name}') # This line causes the N+1 issue
    # ... render template

# AI-Suggested Optimization using prefetch_related or select_related
def list_books_efficient(request):
    """
    The AI tool suggests using `select_related` to fetch the author
    data in a single, efficient JOIN query.
    """
    books = Book.objects.select_related('author').all()
    for book in books:
        print(f'"{book.title}" by {book.author.name}')
    # ... render template
The AI tool would scan the code, understand the relationship between the `Book` and `Author` models, and recognize that iterating and accessing the foreign key within a loop will result in a flurry of database queries. It would then recommend using `select_related(‘author’)` to solve the problem, a crucial optimization for application performance.
Best Practices for Adopting AI Debugging Tools
While AI offers tremendous potential, integrating it effectively requires a thoughtful approach. Simply turning on a new tool is not enough. To maximize benefits and avoid common pitfalls, teams should adhere to a set of best practices.
Human Oversight is Non-Negotiable
The most critical rule is to treat AI as a powerful assistant, not an infallible oracle. AI-suggested patches are based on patterns and probabilities; they may not always grasp the full business logic or subtle architectural constraints of your application. Developers must always review, understand, and test any code suggested by an AI. Blindly accepting a patch can introduce new, more insidious bugs. The developer’s expertise and domain knowledge remain the ultimate authority.

Choosing the Right Tools for the Job
The market for AI developer tools is exploding. When selecting a tool, consider the following factors:
- Language and Framework Support: Ensure the tool has robust support for your specific tech stack (e.g., TypeScript, React, Go, Django).
- Integration Capabilities: It should integrate smoothly with your existing IDE, version control system, and CI/CD pipeline.
- Accuracy and Signal-to-Noise Ratio: A good tool minimizes false positives. Use trial periods to evaluate how relevant and actionable its findings are for your codebase.
- Security and Privacy: Be clear on how the tool handles your source code. Does it send code to the cloud? If so, what are the data privacy and security guarantees?
Fine-Tuning and Providing Context
The best AI systems learn and adapt. Some advanced tools can be fine-tuned on your organization’s private codebase, allowing them to learn your specific coding patterns, conventions, and architectural designs. This dramatically improves the relevance of their suggestions. Furthermore, developers can help the AI by providing good context through clear commit messages, detailed pull request descriptions, and well-documented code. The more context the AI has, the more accurate its analysis will be.
The Future is Now: Embracing AI in Your Debugging Strategy
The integration of Artificial Intelligence into developer tools marks a fundamental evolution in software development. By embracing the “shift-left” philosophy, we are moving away from a reactive, time-consuming debugging process towards a proactive, intelligent, and continuous model of quality assurance. AI-powered tools are no longer a futuristic concept; they are practical solutions that are available today, ready to be integrated into our daily workflows.
The key takeaways are clear: AI enhances developer productivity by automating bug detection, provides actionable and educational feedback through suggested patches, and accelerates problem-solving with deep root cause analysis. By automating the tedious aspects of code analysis and debugging, these tools free up developers to focus on what they do best: solving complex problems and building innovative features. The next step for every development team is to begin exploring these tools, experimenting with their integration, and building a strategy to make AI a core component of their development and debugging lifecycle.