There are few alerts more dreaded by developers and SREs than the infamous OOMKilled (Out of Memory Killed) error in a Kubernetes cluster. It’s an abrupt, unceremonious end to an application process, often happening at the worst possible time. While it might seem like a mysterious cluster-level issue, the root cause is almost always the same: your application is consuming more memory than it was allocated. This is the final, dramatic symptom of a deeper problem—a memory leak or inefficient memory usage.
Memory debugging is the systematic process of identifying, analyzing, and fixing these memory-related issues. It’s a critical skill in modern software development, especially in resource-constrained environments like containers and microservices. Ignoring memory management can lead to degraded performance, application instability, and cascading failures across your system. This comprehensive guide will equip you with the concepts, tools, and techniques to transform memory debugging from a painful chore into a manageable and insightful process, covering everything from fundamental principles to advanced strategies for containerized applications.
Understanding the Memory Landscape: The Root of the Problem
Before diving into tools and techniques, it’s essential to understand how applications manage memory. Misunderstanding these core concepts is often where memory-related bugs originate. Application memory is primarily divided into two areas: the stack and the heap.
The Anatomy of Application Memory: Stack vs. Heap
The Stack is a region of memory used for static memory allocation. It’s highly organized and managed by the CPU. When a function is called, a “stack frame” is created to store local variables, pointers, and function parameters. This memory is automatically reclaimed when the function exits. The stack is fast and efficient, but its size is limited. You typically don’t see memory leaks on the stack; instead, you might encounter a “stack overflow” if you have excessively deep recursion.
The Heap is used for dynamic memory allocation and is where all objects, data structures, and other complex variables are stored. Unlike the stack, the heap is not managed automatically by the CPU. In languages like Python and JavaScript, a process called the Garbage Collector (GC) periodically runs to identify and free up memory that is no longer in use. Most memory leaks occur on the heap when the garbage collector is unable to reclaim memory because an unintentional reference to an object is still being held somewhere in the application.
What is a Memory Leak?
A memory leak occurs when your program allocates memory on the heap but fails to release it after it’s no longer needed. Because a reference to this memory still exists, the garbage collector assumes it’s still in use and won’t free it. Over time, these unreleased memory blocks accumulate, causing the application’s memory footprint to grow continuously until it exhausts its allocated resources and crashes.
A common source of leaks is global collections that are never pruned. Consider this simple Python example where data is continuously added to a global list, but never removed.
import time

# A global list to store historical data
request_history = []

def process_request(data):
    """
    Processes incoming data and stores it in a global history list.
    This function "leaks" memory by design because request_history grows indefinitely.
    """
    processed_data = {
        "data": data,
        "timestamp": time.time()
    }
    request_history.append(processed_data)
    print(f"History size: {len(request_history)}")

# Simulate a long-running server process
for i in range(10000):
    process_request({"user_id": 123, "payload": f"data_{i}"})
    time.sleep(0.01)

# In a real server, this loop would run forever, and the memory
# consumed by request_history would never be reclaimed.
In this scenario, request_history will grow unbounded, consuming more and more memory. This is a classic memory leak pattern that is easy to create but can be difficult to spot in a large, complex application.
Your Toolkit: Practical Memory Debugging Tools and Techniques
Identifying that you have a memory leak is the first step. The next, more challenging step is pinpointing its exact source. Fortunately, modern development ecosystems provide powerful profiling tools to help with this task.

Memory usage graph – Memory-checked Response. In the second stage, TTM generates …
Python Debugging: Pinpointing Leaks with tracemalloc
Python’s standard library includes the tracemalloc module, a powerful tool for dynamic memory analysis. It can trace every memory block allocated by Python, helping you find the exact lines of code responsible for the largest or most numerous allocations.
To debug the previous example, we can use tracemalloc to take snapshots of the memory heap at different points in time and compare them.
import time
import tracemalloc

# A global list to store historical data
request_history = []

def process_request(data):
    processed_data = {
        "data": data,
        "timestamp": time.time()
    }
    request_history.append(processed_data)

# --- Memory Debugging with tracemalloc ---

tracemalloc.start()

# Take a snapshot before the loop starts
snapshot1 = tracemalloc.take_snapshot()

# Simulate processing 5000 requests
for i in range(5000):
    process_request({"user_id": 123, "payload": f"data_{i}"})

# Take a snapshot after the loop
snapshot2 = tracemalloc.take_snapshot()

# Stop tracing
tracemalloc.stop()

# Compare the two snapshots to see the difference
top_stats = snapshot2.compare_to(snapshot1, 'lineno')

print("[ Top 10 memory differences ]")
for stat in top_stats[:10]:
    print(stat)
Running this script will produce output showing exactly where the memory growth is coming from. The output will point directly to the line request_history.append(processed_data), identifying it as the source of the continuous memory allocation. This makes tracemalloc an invaluable tool for Python debugging and bug fixing.
Node.js Debugging: Using Chrome DevTools and Heap Snapshots
Node.js is built on Google’s V8 JavaScript engine, which comes with a world-class set of developer tools. You can leverage the Chrome DevTools to perform in-depth memory debugging on a Node.js application.
A common cause of memory leaks in Node.js applications is improperly managed event listeners. When a listener is attached to a long-lived event emitter, it can create a closure that prevents objects from being garbage collected.
const EventEmitter = require('events');

// A global, long-lived event emitter
const globalEmitter = new EventEmitter();

class LeakyClass {
    constructor() {
        this.data = new Array(1e6).join('*'); // Simulate a large object
        // This listener creates a closure over `this`, preventing
        // any instance of LeakyClass from being garbage collected.
        globalEmitter.on('some-event', () => {
            this._doSomething();
        });
    }

    _doSomething() {
        // ...
    }
}

// Simulate requests that create short-lived objects
setInterval(() => {
    const myObject = new LeakyClass();
    // We expect myObject to be garbage collected after this function scope ends,
    // but the event listener on globalEmitter holds a reference to it.
    console.log(`Memory usage: ${Math.round(process.memoryUsage().heapUsed / 1024 / 1024)} MB`);
}, 1000);
To debug this, you can run your Node.js application with the --inspect flag:
node --inspect leaky_app.js
Then, open Google Chrome and navigate to chrome://inspect. You will see your Node.js application listed as a target. Clicking “inspect” opens the DevTools. From there:
- Navigate to the Memory tab.
- Select Heap snapshot and click Take snapshot. This is your baseline.
- Let the application run for a minute to allow the leak to manifest.
- Take a second snapshot.
- In the view dropdown, select Comparison. This view shows you which objects have been created between the two snapshots and are still in memory.
By inspecting the comparison, you will see a growing number of LeakyClass objects. Clicking on one will show you the “Retainers” path, which is the chain of references keeping the object alive. In this case, it will point directly to the listener on the globalEmitter, revealing the source of the leak.
The Modern Battlefield: Memory Debugging in Docker and Kubernetes
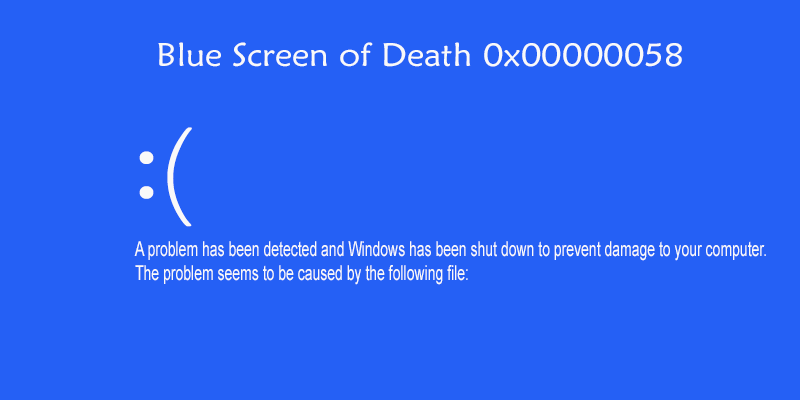
Debugging memory issues inside a containerized environment like Kubernetes adds another layer of complexity. Your application isn’t just running on a machine; it’s running inside an isolated cgroup with strict memory limits. This is where the OOMKilled event comes from—it’s the Linux kernel’s Out Of Memory (OOM) killer terminating your process to protect the stability of the node.
Step 1: Monitoring and Observation in Kubernetes
Memory usage graph – aMeta: an accurate and memory-efficient ancient metagenomic …
Your first line of defense in Kubernetes debugging is monitoring. Before you even start profiling, you need to understand your application’s memory consumption patterns under normal load.
- Basic CLI Commands: Use
kubectl top pod <pod-name> --containersto get a real-time snapshot of CPU and memory usage for a specific pod. - Monitoring Stacks: A combination of Prometheus for collecting metrics and Grafana for visualization is the industry standard. By scraping metrics from the Kubernetes API server and cAdvisor, you can create dashboards that track memory usage over time. A chart showing a saw-tooth pattern (memory grows, then drops after garbage collection) is often healthy, while a line that consistently trends upwards is a clear sign of a memory leak.
It is also critical to set proper resource requests and limits in your Kubernetes manifests. Requests guarantee a certain amount of memory for your pod, while limits prevent it from consuming more than its allocation and destabilizing the node.
apiVersion: apps/v1
kind: Deployment
metadata:
  name: my-app-deployment
spec:
  replicas: 3
  selector:
    matchLabels:
      app: my-app
  template:
    metadata:
      labels:
        app: my-app
    spec:
      containers:
      - name: my-app-container
        image: my-app:1.0.0
        resources:
          requests:
            memory: "256Mi" # Request 256 MiB of memory
            cpu: "250m"
          limits:
            memory: "512Mi" # Limit the container to 512 MiB
            cpu: "500m"
Step 2: Profiling a Live Container
Once you’ve identified a leaky pod, you need to get a memory profile from it. This is where remote debugging comes in handy.
For a Node.js application, you can enable the inspector by modifying the container’s command to include the --inspect=0.0.0.0:9229 flag. Then, use kubectl port-forward to create a secure tunnel from your local machine to the pod:
kubectl port-forward pod/my-leaky-pod-xyz 9229:9229
Now you can connect Chrome DevTools from your local machine to the process running inside the Kubernetes cluster and use the same heap snapshot techniques described earlier. This powerful method of remote debugging allows you to perform deep dynamic analysis on a live, running service in a production-like environment.
Memory usage graph – Hot Selling Used Original Branded Rx580 8gb 2304 2048 Graphic …
Prevention is Better Than Cure: Proactive Strategies and Best Practices
The most effective way to handle memory leaks is to prevent them from happening in the first place. Adopting a set of best practices for memory management can significantly reduce the occurrence of memory-related bugs.
Writing Memory-Conscious Code
- Manage Resource Lifecycles: Always ensure that resources like file handles, network sockets, and database connections are explicitly closed when they are no longer needed. Use language constructs like Python’s
withstatement or atry...finallyblock to guarantee cleanup. - Use Weak References for Caches: If you are implementing a cache, consider using data structures that hold weak references to their objects (like
WeakMapin JavaScript or Python’sweakrefmodule). This allows the garbage collector to reclaim the cached objects if they are no longer referenced anywhere else in the application. - Be Wary of Closures and Global State: Minimize the use of global variables. Be mindful of closures and event listeners, ensuring they are removed when the objects they reference are meant to be destroyed.
Integrating Memory Analysis into Your Workflow
Don’t wait for production issues to start thinking about memory. Integrate memory profiling into your development and testing lifecycle.
- Load Testing: Use tools like k6, JMeter, or Locust to simulate production traffic against your application in a staging environment. Monitor memory usage during these tests to see how your application behaves under stress.
- CI/CD Debugging: Create automated integration tests that run for an extended period while monitoring memory usage. A test that fails if memory consumption exceeds a certain threshold can catch leaks before they are ever deployed.
Conclusion: Mastering Memory Management
Memory debugging, while initially daunting, is a learnable and essential skill for any software developer. The journey from a cryptic OOMKilled error to a resolved bug is a systematic one. It begins with understanding the fundamental concepts of stack and heap memory, progresses to leveraging powerful profiling tools like Python’s tracemalloc and the Chrome DevTools for Node.js, and extends to advanced techniques for debugging within complex Kubernetes environments.
The key takeaway is to be proactive. By writing memory-conscious code, establishing robust monitoring, and integrating memory analysis into your testing workflows, you can catch and fix issues long before they impact your users. Treat every memory-related bug not as a crisis, but as an opportunity to deepen your understanding of your application’s behavior and build more resilient, performant, and reliable software.


