In the world of software development, debugging is an unavoidable and critical skill. While web developers have long enjoyed a rich ecosystem of browser-based tools, mobile debugging presents a unique set of challenges. From device fragmentation and OS-specific quirks to the complexities of hardware interaction and hybrid architectures, finding and fixing bugs in mobile applications requires a specialized toolkit and a methodical approach. A single persistent bug can lead to negative app store reviews, user churn, and a damaged brand reputation, making effective mobile debugging a cornerstone of building successful applications.
Mastering mobile debugging is not just about fixing crashes; it’s about understanding the entire application lifecycle. It involves deep dives into UI layouts, meticulous network request analysis, and careful performance profiling to ensure a smooth and delightful user experience. This comprehensive guide will walk you through the essential concepts, practical techniques, and advanced strategies for debugging native (iOS and Android) and cross-platform (React Native) applications. Whether you’re a seasoned mobile developer or just starting, you’ll find actionable insights and best practices to elevate your Software Debugging skills and build more robust, reliable mobile apps.
Understanding the Mobile Debugging Ecosystem
Before diving into specific techniques, it’s crucial to understand the landscape of Mobile Debugging. The tools and methods you use will largely depend on your application’s technology stack. The core distinction lies between native and cross-platform development, each with its own ecosystem and debugging philosophy.
Native vs. Cross-Platform Debugging
Native Debugging involves using the official Integrated Development Environments (IDEs) provided by the platform owners: Xcode for iOS and Android Studio for Android. These IDEs offer powerful, low-level access to the running application. Developers can leverage sophisticated tools for Memory Debugging, UI inspection, and performance profiling that are deeply integrated with the operating system.
Cross-Platform Debugging, particularly for frameworks like React Native, introduces another layer of complexity. Here, you’re often dealing with a JavaScript runtime executing business logic and a native layer rendering the UI. This necessitates a hybrid approach. While you still use Xcode or Android Studio for native-level issues, a significant portion of your JavaScript Debugging will happen using tools like Chrome DevTools, which connect to the JavaScript engine running on the device or simulator.
Essential Tools of the Trade
A developer is only as good as their tools, and the mobile world is no exception. Here are the foundational Debug Tools you must know:
- Android Studio: The all-in-one IDE for Android development. Its key features include Logcat for viewing system and app logs, a powerful step-through debugger, a Layout Inspector for visual UI debugging, and a comprehensive Profiler for analyzing CPU, memory, and network usage.
- Xcode: Apple’s IDE for all things iOS, macOS, and beyond. It features LLDB (the LLVM debugger) for powerful command-line debugging, a visual View Debugger for untangling complex UI hierarchies, and Instruments, a suite of tools for in-depth Performance Monitoring and leak detection.
- Flipper: An extensible mobile app debugging platform created by Facebook. Flipper provides a desktop interface with a suite of powerful plugins for inspecting layouts, monitoring network requests, viewing device logs, and more. It offers a unified experience for debugging both native Android/iOS and React Native apps.
The Foundational Power of Logging
Before you even set a breakpoint, effective logging is your first line of defense. Logging and Debugging go hand-in-hand. Simple log statements can help you trace execution flow, inspect variable values at runtime, and understand the sequence of events leading to an error. In Android, this is primarily done via the Log class, with output appearing in the Logcat window.
// Example of structured logging in an Android (Kotlin) application
import android.util.Log

class LoginViewModel : ViewModel() {
    private val TAG = "LoginViewModel"

    fun attemptLogin(username: String, pass: String) {
        if (username.isBlank() || pass.isBlank()) {
            // Use Log.w for warnings that aren't critical errors
            Log.w(TAG, "Login attempt with empty credentials.")
            return
        }

        // Use Log.d for debug messages to trace execution
        Log.d(TAG, "Attempting login for user: $username")

        try {
            // ... network call logic ...
            Log.i(TAG, "Login successful for user: $username")
        } catch (e: Exception) {
            // Use Log.e to report errors with stack traces
            Log.e(TAG, "Login failed for user: $username", e)
        }
    }
}
Hands-On Debugging: From Breakpoints to Network Inspection
Once logging has helped you narrow down a problem area, it’s time for more interactive Code Debugging. This involves pausing your application’s execution to inspect its state in real-time, analyzing the UI hierarchy, and monitoring data flowing in and out of the app.

Mastering Breakpoints and Step-Through Debugging
Breakpoints are the cornerstone of interactive debugging. By setting a breakpoint on a line of code, you instruct the debugger to pause execution right before that line is run. Once paused, you can:
- Inspect Variables: View the current value of all local and global variables in scope.
- Evaluate Expressions: Use the Debug Console (like LLDB in Xcode) to run arbitrary code or evaluate expressions in the current context.
- Control Execution: Step over, into, or out of functions to trace the execution path line by line and understand how the program state changes.
This level of control is invaluable for understanding complex logic, race conditions, and incorrect state management—issues that simple logs might not reveal.
UI and Layout Debugging
A common source of bugs in mobile apps is the user interface. Elements might be misplaced, overlapping, or missing entirely. Visual debugging tools are essential for solving these issues. Both Xcode’s View Debugger and Android Studio’s Layout Inspector allow you to capture a snapshot of your app’s UI and explore it in a 3D, exploded hierarchy. You can select individual UI elements, inspect all their properties (like size, position, and color), and identify the source of layout conflicts. This is a critical part of Frontend Debugging on mobile.
For example, in iOS, a common issue is conflicting Auto Layout constraints. The code below might create an ambiguous layout that the View Debugger can help diagnose instantly.
// Example of a potential Auto Layout issue in Swift (iOS)
import UIKit

class ProfileViewController: UIViewController {
    override func viewDidLoad() {
        super.viewDidLoad()

        let profileImageView = UIImageView()
        profileImageView.translatesAutoresizingMaskIntoConstraints = false
        profileImageView.backgroundColor = .lightGray
        view.addSubview(profileImageView)

        // This constraint might conflict with another one, e.g., one set in a Storyboard
        // or another programmatic constraint.
        NSLayoutConstraint.activate([
            profileImageView.centerXAnchor.constraint(equalTo: view.centerXAnchor),
            profileImageView.topAnchor.constraint(equalTo: view.safeAreaLayoutGuide.topAnchor, constant: 20),
            profileImageView.widthAnchor.constraint(equalToConstant: 100),
            profileImageView.heightAnchor.constraint(equalToConstant: 100),

            // Potentially conflicting constraint: trying to also pin it to the leading edge
            profileImageView.leadingAnchor.constraint(equalTo: view.leadingAnchor, constant: 20)
        ])

        // Xcode's View Debugger would highlight the conflicting constraints at runtime.
    }
}
Network Debugging: Inspecting API Calls
Modern mobile apps are rarely self-contained; they constantly communicate with backend services. API Debugging and Network Debugging are therefore critical skills. When an app isn’t displaying the right data, the problem could be in the frontend logic, the network request, or the API response. Tools like Flipper’s Network Inspector or standalone proxies like Charles or Proxyman allow you to intercept and inspect all HTTP/S traffic from your device or simulator. You can view request headers, payloads, response codes, and JSON bodies to verify that your app is sending and receiving data correctly. This is an essential part of Full Stack Debugging.
Tackling Complex Bugs: Advanced and Cross-Platform Scenarios
As applications grow in complexity, so do their bugs. Advanced issues often involve asynchronous operations, memory management, or the bridge between JavaScript and native code in cross-platform apps. This requires more specialized tools and techniques.
Remote JavaScript Debugging in React Native
React Debugging within the React Native framework relies on a clever architecture. When you enable “Debug JS Remotely,” the app’s JavaScript code is executed not on the mobile device itself, but in a separate V8 engine, typically within a Chrome tab. This allows you to use the familiar Chrome DevTools for a powerful Web Debugging experience.
You can set breakpoints directly in your JavaScript/TypeScript code, inspect props and state, use the console for logging, and analyze performance with the profiler. This method is indispensable for debugging complex state logic in Redux, MobX, or React’s Context API. However, be aware that this can affect performance and timing, so it’s not always a perfect representation of how the code runs on the device.

// Example of a state update bug in a React Native component
import React, { useState } from 'react';
import { Button, Text, View } from 'react-native';

const CounterComponent = () => {
  const [count, setCount] = useState(0);

  const handleIncrement = () => {
    // A common bug: updating state based on the previous state incorrectly.
    // If this function is called rapidly, the updates may not be based on the latest value.
    setCount(count + 1);
    setCount(count + 1); // This will not increment the count by 2!

    // The correct way using a functional update
    // setCount(prevCount => prevCount + 2);

    // Using console.log is a simple debugging step.
    // A breakpoint here in Chrome DevTools would let you inspect the value of 'count'
    // before and after the setCount calls.
    console.log(`Incrementing count. Current value is: ${count}`);
  };

  return (
    <View>
      <Text>Count: {count}</Text>
      <Button title="Increment" onPress={handleIncrement} />
    </View>
  );
};

export default CounterComponent;
Memory Debugging and Performance Profiling
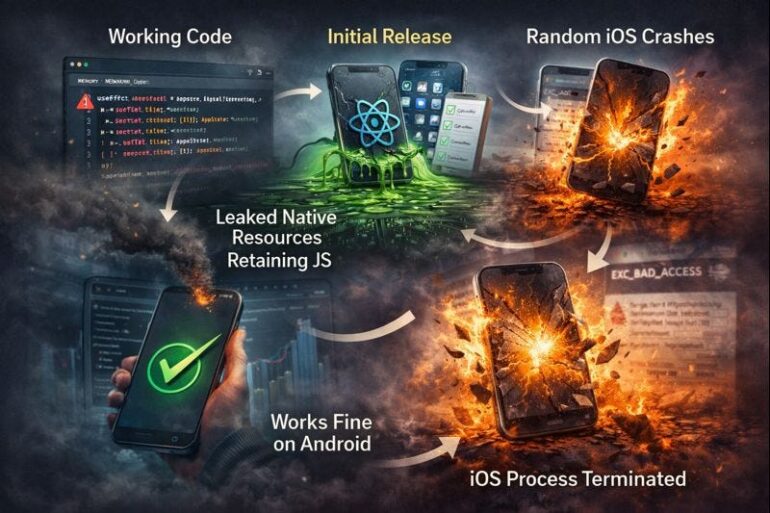
Slow performance and crashes can often be traced back to memory issues, such as memory leaks (where objects are no longer needed but are not deallocated) or high memory churn. Debug Performance is a proactive process. Tools like Xcode Instruments and the Android Studio Profiler provide powerful Profiling Tools for Dynamic Analysis. You can:
- Track Allocations: See exactly which objects are being created and where.
- Detect Leaks: Use built-in leak detection tools to find objects that are being retained unnecessarily.
- Profile CPU Usage: Identify functions or processes that are consuming excessive CPU time, causing your UI to stutter.
Regularly profiling your app, especially during performance-critical operations, is a key practice for maintaining a high-quality user experience.
From Reactive Bug Fixing to Proactive Quality Assurance
The ultimate goal of debugging is not just to fix bugs, but to prevent them. A mature development process incorporates strategies that catch issues early and provide visibility into the application’s health in production.
Integrating Error Tracking and Monitoring
You can’t fix bugs you don’t know about. Production Debugging relies on robust Error Tracking and Error Monitoring services like Sentry, Bugsnag, or Firebase Crashlytics. Integrating one of these SDKs into your app allows you to automatically capture and report crashes and unhandled exceptions from users in the wild. These reports are aggregated in a dashboard and typically include detailed Stack Traces, device information (OS version, model), and user context, providing invaluable clues for reproducing and fixing bugs that you might never see during development.
The Role of Testing in Debugging
Testing and Debugging are two sides of the same coin. A comprehensive test suite is one of the most effective bug prevention tools.
- Unit Tests verify individual functions or components in isolation, making it easy to pinpoint failures in business logic. Unit Test Debugging is often simpler because the scope is so small.
- Integration Tests ensure that different parts of your app work together correctly, catching issues at the boundaries between modules or between the app and an API.
When a test fails, it acts as a perfect starting point for a debugging session, giving you a reproducible case that isolates the problem.
Leveraging Static Analysis
Static Analysis tools like SwiftLint for iOS or the built-in Lint checks in Android Studio analyze your code without actually running it. They can automatically detect potential bugs, style violations, and “code smells” based on a predefined set of rules. This form of Code Analysis helps enforce best practices and catches common errors, like potential null pointer exceptions or unused variables, before they ever become runtime bugs.
Conclusion: Building Better Apps Through Better Debugging
Mobile debugging is a deep and challenging discipline, but it is also an incredibly rewarding one. By moving beyond simple print statements and embracing the powerful tools available in the native and cross-platform ecosystems, you can drastically reduce the time it takes to find and fix bugs. A truly effective debugging strategy is multi-layered, combining proactive logging, interactive step-through debugging, comprehensive performance profiling, and automated error monitoring.
The key takeaway is to be methodical. Start with the foundational tools like logs and breakpoints to understand the problem. Use specialized Developer Tools like layout inspectors and network profilers to diagnose specific issues. Finally, implement proactive measures like automated testing, static analysis, and production error tracking to build a safety net that catches bugs early. By mastering these techniques and adopting these Debugging Best Practices, you will not only become a more efficient developer but will also consistently deliver the high-quality, stable, and performant mobile applications that users expect and deserve.


