The Art and Science of Backend Debugging
In the world of software development, writing code is only half the battle. The other, often more challenging half, is debugging. For backend developers, this process can feel like being a detective in a complex digital mystery. Bugs can hide in intricate business logic, asynchronous operations, database queries, or the vast, interconnected web of microservices. While a perfectly functioning backend system is a testament to skillful engineering, the journey to get there is paved with late nights, cryptic error messages, and the relentless pursuit of “why.” Effective backend debugging is not just a necessary evil; it is a core competency that separates good developers from great ones. It transforms frustration into a systematic process of investigation, diagnosis, and resolution, ultimately leading to more robust, reliable, and performant applications. This article will guide you through the essential techniques, tools, and best practices to master the art of backend debugging, from foundational principles to advanced strategies for modern, distributed systems.
Section 1: The Foundations of Effective Debugging
Before diving into sophisticated tools, it’s crucial to master the fundamentals. These core concepts form the bedrock of any successful debugging session, providing the initial clues needed to start your investigation. Without a solid grasp of logging and interpreting errors, even the most advanced tools will be of little use.
Understanding Stack Traces
The stack trace is the first piece of evidence you’ll encounter when an error occurs. It’s a report of the active stack frames at a certain point in time during the execution of a program. In simpler terms, it’s a breadcrumb trail showing you exactly which functions were called, in what order, leading up to the error. Learning to read a stack trace effectively is a non-negotiable skill for any developer.
Consider this simple Node.js and Express application with a bug:
// app.js
const express = require('express');
const app = express();

function getUserDetails(user) {
  // This will throw a TypeError if user is null or undefined
  return user.profile.name;
}

function processRequest(requestData) {
  const user = null; // Simulating a scenario where a user is not found
  const userName = getUserDetails(user);
  return { success: true, user: userName };
}

app.get('/user', (req, res) => {
  try {
    const result = processRequest(req.body);
    res.json(result);
  } catch (error) {
    console.error('An error occurred:', error);
    res.status(500).send('Internal Server Error');
  }
});

app.listen(3000, () => {
  console.log('Server running on port 3000');
});
When you hit the /user endpoint, the application will crash inside the try...catch block, and you’ll see a stack trace in your console that looks something like this:
TypeError: Cannot read properties of null (reading 'profile')
    at getUserDetails (/path/to/your/project/app.js:6:17)
    at processRequest (/path/to/your/project/app.js:11:20)
    at /path/to/your/project/app.js:18:20
    at Layer.handle [as handle_request] (.../node_modules/express/lib/router/layer.js:95:5)
    ... (more lines from Express internals)
To decipher this, read from the top down. The first line tells you the error type (TypeError) and the message. The subsequent lines show the call stack. The most important line for your code is usually the first one that points to a file you wrote: at getUserDetails (/path/to/your/project/app.js:6:17). This tells you the error happened in the getUserDetails function on line 6, character 17.
Strategic Logging
While stack traces tell you where an error happened, logging tells you the story leading up to it. The most basic form is “print debugging” (e.g., using console.log()), but a more structured approach is far more powerful. Use different log levels (DEBUG, INFO, WARN, ERROR) to categorize messages. In production, you typically only log INFO and above, but in development, you can enable DEBUG for more verbose output.
Libraries like Winston or Pino for Node.js, and the built-in logging module in Python, are essential for robust logging and debugging. They allow for structured, JSON-formatted logs, which are machine-readable and invaluable for log analysis tools.
// Using Winston for structured logging
const winston = require('winston');

const logger = winston.createLogger({
  level: 'info',
  format: winston.format.json(),
  transports: [
    new winston.transports.Console(),
    new winston.transports.File({ filename: 'error.log', level: 'error' }),
    new winston.transports.File({ filename: 'combined.log' }),
  ],
});

// Example usage
function processRequest(requestData, requestId) {
  logger.info('Processing request', { requestId, data: requestData });

  const user = null; // Simulating a bug
  if (!user) {
    logger.warn('User not found for request', { requestId });
  }

  try {
    const userName = user.profile.name;
    return { success: true, user: userName };
  } catch (error) {
    logger.error('Failed to get user details', { requestId, error: error.message, stack: error.stack });
    throw error; // Re-throw the error to be handled upstream
  }
}
This structured approach to logging and debugging provides far more context than a simple console.log, making bug fixing significantly faster.
Section 2: Interactive Debugging and Essential Tools
Logging is a passive form of debugging. Interactive debugging, on the other hand, is an active process. It allows you to pause your application’s execution at specific points, inspect the state (variables, memory, call stack), and step through the code line by line. This is one of the most powerful code debugging techniques available.
![microservices architecture diagram - Microservices architecture example [10] | Download Scientific Diagram](https://debuglab.net/wp-content/uploads/2025/12/inline_90480e20.jpg)
Node.js Debugging with the Inspector
Node.js has a powerful built-in debugger that can be accessed via the V8 Inspector protocol. The easiest way to use it is by pairing it with Chrome DevTools.
To start a debugging session, run your Node.js application with the --inspect flag:
node --inspect app.jsThis will start your application and print a URL to the console. Open Google Chrome, navigate to chrome://inspect, and you will see your Node.js application listed as a target. Clicking “inspect” will open a dedicated DevTools window connected to your backend process. You can now set breakpoints directly in your source code, step through execution, inspect variables in scope, and even execute arbitrary code in the debug console.
You can also programmatically set a breakpoint using the debugger; statement in your code. When the inspector is attached, execution will automatically pause whenever it encounters this statement.
// ... inside a function you want to debug
app.get('/user', (req, res) => {
  console.log('Request received, about to process...');

  // Execution will pause here if the inspector is attached
  debugger;

  try {
    const result = processRequest(req.body);
    res.json(result);
  } catch (error) {
    // ... error handling
  }
});
This method is invaluable for API debugging, as you can trigger a request with a tool like Postman and then step through the entire request lifecycle on your backend.
Python Debugging with PDB
Python developers have a similar tool in the standard library: pdb, the Python Debugger. It’s a command-line-based interactive debugger that is simple yet incredibly effective for backend services written in frameworks like Django or Flask.
To use it, you can insert a breakpoint in your code by importing the module and calling pdb.set_trace().
import pdb

def calculate_discount(price, discount_percentage):
    # Let's debug the state of these variables
    pdb.set_trace()

    if not isinstance(price, (int, float)) or not isinstance(discount_percentage, (int, float)):
        raise TypeError("Inputs must be numeric")

    discount_amount = price * (discount_percentage / 100)
    final_price = price - discount_amount
    return final_price

# Example call
try:
    final = calculate_discount(100, "10") # Passing a string to cause a TypeError
    print(f"Final price: {final}")
except TypeError as e:
    print(f"Error: {e}")
When you run this script, execution will pause where pdb.set_trace() is called, and you will be dropped into an interactive shell. Here, you can type commands like p price (print the value of `price`), n (execute the next line), c (continue execution until the next breakpoint), or q (quit the debugger).
Section 3: Advanced Debugging for Complex Systems
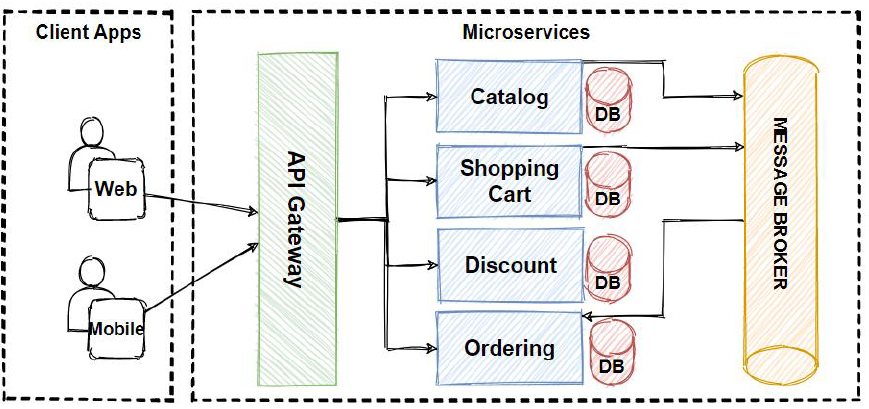
Modern backend architectures, especially those based on microservices, introduce new layers of complexity. Debugging is no longer confined to a single process but can span across multiple services, networks, and databases. This requires more advanced techniques and tools.
Microservices Debugging with Distributed Tracing
In a microservices architecture, a single user request might trigger a chain of calls across a dozen different services. If one of them fails, how do you trace the original request? The answer is distributed tracing. The core idea is to assign a unique correlation ID (or trace ID) to every initial request that enters the system. This ID is then passed along in the headers of every subsequent network call between services.
By ensuring all logs and metrics for a given request chain are tagged with the same correlation ID, you can aggregate them in a central location and reconstruct the entire journey of the request. Open-source standards like OpenTelemetry and tools like Jaeger and Zipkin are designed specifically for this purpose. Implementing them allows you to visualize request flows, identify bottlenecks, and pinpoint which service is the source of an error in a distributed system.
Memory Debugging and Profiling
Memory leaks are insidious bugs where an application fails to release memory it no longer needs. Over time, this can lead to degraded performance and eventual crashes. Debugging memory issues requires profiling tools that can take snapshots of the application’s memory heap.
In Node.js, you can use the memory profiler in Chrome DevTools (connected via the inspector) to take heap snapshots at different times. By comparing snapshots, you can identify objects that are being allocated but never garbage collected. Libraries like heapdump can also be used to programmatically generate snapshots that you can analyze later.
A common cause of memory leaks in Node.js is improperly managed event listeners. For example, adding an event listener on every request without ever removing it will cause the listener collection to grow indefinitely.
Async Debugging Challenges
Asynchronous code, with its callbacks, promises, and async/await syntax, can make stack traces difficult to follow. An error might occur long after the function that initiated the operation has returned. Modern JavaScript (with async/await) has greatly improved this with “async stack traces,” which attempt to reconstruct the logical call stack across asynchronous boundaries. When debugging async code, pay close attention to unhandled promise rejections, as they can silently fail without crashing the application unless properly caught.
Section 4: Best Practices and Proactive Strategies
The most effective debugging is the one you don’t have to do. By adopting proactive strategies and building a culture of quality, you can prevent many bugs from ever reaching production.
Embrace Comprehensive Testing
A robust test suite is your first line of defense. Unit tests help you debug individual functions in isolation. Integration tests are crucial for debugging interactions between different parts of your system, such as your application and its database. A failing test provides immediate, repeatable context for a bug, making the fix much easier than trying to reproduce an error reported by a user.
Implement Application Performance Monitoring (APM)
Tools like Datadog, New Relic, and Sentry go beyond simple logging. They provide full-stack observability, combining error tracking, performance monitoring, and distributed tracing into a single platform. These APM tools can automatically capture unhandled exceptions, group them, and alert you with rich context, including the stack trace, request parameters, and user information. This is essential for production debugging, where you can’t attach an interactive debugger.
Leverage Static Analysis and Linters
Static analysis tools (linters) like ESLint for JavaScript or Pylint for Python can catch common errors and code smells before you even run your code. Enforcing a consistent code style and flagging potential issues like unused variables or unreachable code reduces the surface area for bugs. This form of debug automation is a key part of any modern CI/CD pipeline.
Debugging in Containerized Environments
When working with Docker and Kubernetes, debugging adds another layer. You need to be comfortable with commands like docker logs to view container output and docker exec to get a shell inside a running container for live investigation. For remote debugging a Node.js application in a Docker container, you must expose the inspector port (e.g., 9229) when running the container, allowing you to connect your local DevTools to the remote process.
Conclusion: Cultivating a Debugging Mindset
Backend debugging is an expansive and evolving field, but the core principles remain constant. It begins with a solid foundation in reading stack traces and implementing strategic, structured logging. From there, you graduate to the power of interactive debuggers like the Node.js Inspector and Python’s PDB, which provide unparalleled insight into your application’s state. For modern, complex systems, mastering advanced techniques like distributed tracing and memory profiling becomes essential.
Ultimately, the most powerful tool is a systematic mindset. Approach every bug not as a roadblock but as a puzzle. Form a hypothesis, use your tools to gather evidence, test your theory, and iterate. By combining this methodical approach with the practical techniques and tools discussed here—from testing and monitoring to static analysis—you can transform debugging from a source of frustration into a rewarding skill that elevates the quality and reliability of everything you build.