Introduction: The Complexity of Distributed Systems
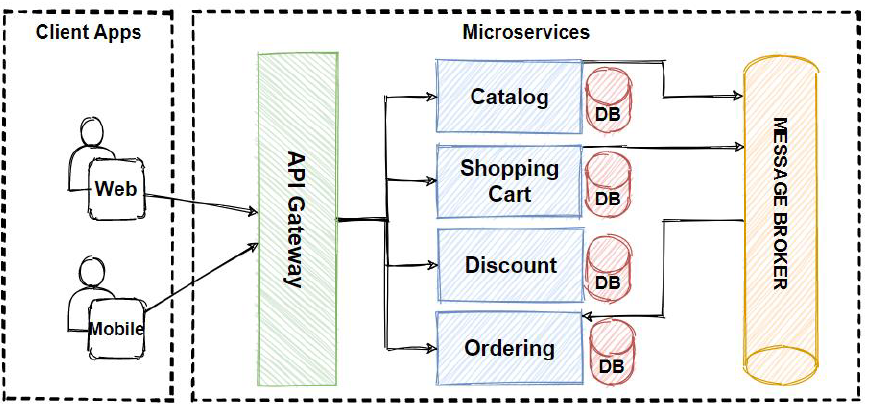
The transition from monolithic architectures to microservices has revolutionized software development, enabling teams to deploy faster, scale independently, and use the best tools for specific jobs. However, this architectural shift introduces a significant trade-off: complexity. In a monolith, Software Debugging is relatively straightforward; you have a single stack trace, a shared memory space, and a centralized log file. In a distributed microservices environment, a single user request might traverse dozens of services, interact with multiple databases, and pass through message queues like Kafka or RabbitMQ.
When a request fails or experiences high latency in this environment, traditional Debugging Techniques often fall short. You cannot simply attach a debugger to a process and step through the code because the execution flow jumps across network boundaries. This leads to the “murder mystery” problem in Backend Debugging: who killed the request? Was it a timeout in the payment service? A deadlock in the inventory database? Or a network blip in the Kubernetes cluster?
To solve this, developers must move beyond basic logging and embrace comprehensive Observability. This article explores advanced Microservices Debugging strategies, focusing on distributed tracing, OpenTelemetry, and Production Debugging best practices. We will delve into how to correlate logs, metrics, and traces to gain a holistic view of your system, ensuring that API Development and maintenance remain manageable at scale.
Section 1: The Pillars of Observability and Distributed Tracing
Effective System Debugging in a microservices architecture relies on three pillars: Logs, Metrics, and Traces. While logs provide discrete event details and metrics show aggregate health trends, distributed tracing is the glue that binds them together. It reconstructs the lifecycle of a request as it propagates through the system.
Understanding Context Propagation
The core concept behind distributed tracing is context propagation. When a request enters your system (e.g., via an ingress controller or frontend application), it is assigned a unique Trace ID. As the request moves from Service A to Service B, this Trace ID—along with a Span ID representing the specific operation—must be passed along (usually via HTTP headers like `traceparent`).
Without context propagation, Error Tracking becomes impossible because logs from Service A cannot be correlated with errors in Service B. Here is a conceptual example using Python to illustrate how context might be manually handled (though libraries usually automate this) during Python Development.
import requests
import logging

# Simulating a manual context propagation (Conceptual)
def call_downstream_service(trace_id, span_id, data):
    url = "http://inventory-service:8080/check-stock"

    # Injecting context into headers
    headers = {
        "X-Trace-ID": trace_id,
        "X-Parent-Span-ID": span_id,
        "Content-Type": "application/json"
    }

    try:
        logging.info(f"Trace {trace_id}: Calling inventory service")
        response = requests.post(url, json=data, headers=headers)
        response.raise_for_status()
        return response.json()
    except requests.exceptions.RequestException as e:
        logging.error(f"Trace {trace_id}: Failed to call inventory service - {str(e)}")
        raise

# In a real-world scenario, OpenTelemetry handles this injection automatically.
In Full Stack Debugging, this context must originate at the client side. Whether you are doing React Debugging, Vue Debugging, or Angular Debugging, the frontend must generate the initial Trace ID so that backend latency can be correlated with the user experience in the browser.
Section 2: Implementing OpenTelemetry in Node.js
OpenTelemetry (OTel) has emerged as the industry standard for Application Debugging and observability. It provides a vendor-neutral way to generate, collect, and export telemetry data. One of its most powerful features is auto-instrumentation, which allows you to trace applications without modifying your business logic significantly.
Let’s look at a practical implementation for Node.js Debugging. Node.js is heavily used in microservices due to its non-blocking I/O, but its asynchronous nature can make Async Debugging difficult. Stack traces often get lost in callback hell or promise chains. OpenTelemetry solves this by preserving context across async boundaries.
Setting up the SDK
To enable tracing in an Express application, you configure the SDK before your application starts. This ensures that all required modules (HTTP, Express, MongoDB, etc.) are patched for Code Analysis.
// tracing.js
const { NodeSDK } = require('@opentelemetry/sdk-node');
const { getNodeAutoInstrumentations } = require('@opentelemetry/auto-instrumentations-node');
const { OTLPTraceExporter } = require('@opentelemetry/exporter-trace-otlp-http');
const { Resource } = require('@opentelemetry/resources');
const { SemanticResourceAttributes } = require('@opentelemetry/semantic-conventions');

// Configure the exporter (e.g., to Jaeger or Zipkin)
const traceExporter = new OTLPTraceExporter({
  url: 'http://localhost:4318/v1/traces',
});

const sdk = new NodeSDK({
  resource: new Resource({
    [SemanticResourceAttributes.SERVICE_NAME]: 'order-service',
    [SemanticResourceAttributes.SERVICE_VERSION]: '1.0.0',
  }),
  traceExporter,
  instrumentations: [getNodeAutoInstrumentations()],
});

// Start the SDK
sdk.start();

console.log('OpenTelemetry initialized for Node.js Debugging');

// Graceful shutdown
process.on('SIGTERM', () => {
  sdk.shutdown()
    .then(() => console.log('Tracing terminated'))
    .catch((error) => console.log('Error terminating tracing', error));
});
By running this code, every HTTP request received by your Express app and every outgoing database query will automatically generate a span. This is crucial for Performance Monitoring, as it allows you to visualize exactly how long a database query took versus the time spent in the Node.js event loop.
Section 3: Advanced Debugging and Custom Instrumentation
While auto-instrumentation covers 80% of use cases, complex Business Logic often requires manual instrumentation. You might want to track a specific algorithmic operation or add custom tags (like `user_id` or `plan_type`) to your spans to aid in Bug Fixing later.
Enriching Spans in Java
In Java or Kotlin microservices (often used with Spring Boot), you can inject the `Tracer` to create custom spans. This is particularly useful for Integration Debugging where you need to track internal processing steps that don’t involve network calls.
import io.opentelemetry.api.trace.Span;
import io.opentelemetry.api.trace.Tracer;
import io.opentelemetry.context.Scope;
import org.springframework.stereotype.Service;

@Service
public class PaymentProcessor {

    private final Tracer tracer;

    public PaymentProcessor(Tracer tracer) {
        this.tracer = tracer;
    }

    public void processPayment(String orderId, double amount) {
        // Create a custom span for this internal operation
        Span span = tracer.spanBuilder("calculate_tax_and_fees").startSpan();

        // Add attributes for better filtering in your observability backend
        span.setAttribute("app.order_id", orderId);
        span.setAttribute("app.amount", amount);

        try (Scope scope = span.makeCurrent()) {
            // Simulate complex logic
            performCalculation();
        } catch (Exception e) {
            // Record the exception in the span
            span.recordException(e);
            // Set status to Error
            span.setStatus(io.opentelemetry.api.trace.StatusCode.ERROR, "Calculation failed");
            throw e;
        } finally {
            span.end(); // CRITICAL: Always end the span!
        }
    }

    private void performCalculation() throws InterruptedException {
        Thread.sleep(50); // Simulating work
    }
}
This code snippet demonstrates how to add attributes to spans. When you are performing Error Monitoring in a tool like Jaeger or Datadog, you can filter traces by `app.order_id` to find exactly why a specific customer’s transaction failed. This significantly reduces the Mean Time to Resolution (MTTR).
Debugging Asynchronous Messaging
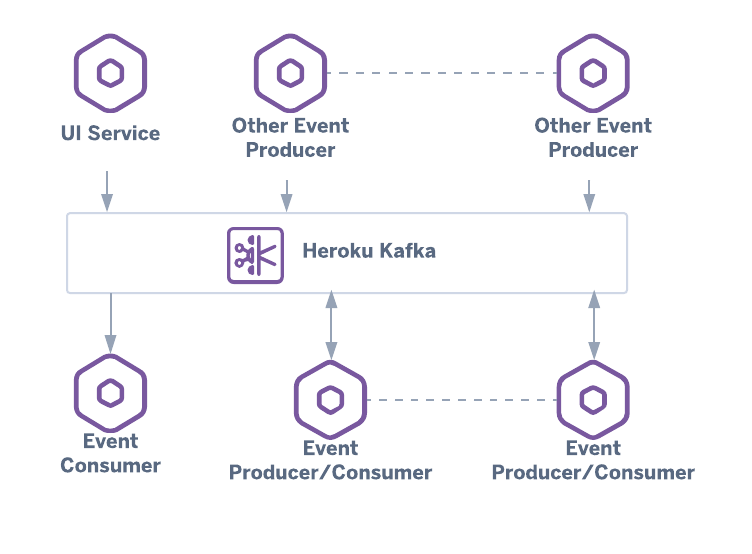
Microservices often communicate via message brokers. Kafka or RabbitMQ introduce a gap in traces if not handled correctly. The producer must inject the trace context into the message metadata, and the consumer must extract it. Most Debug Tools and OTel libraries support this, but understanding the flow is vital for Integration Debugging.
If you see a trace end abruptly at a “produce” span and a new trace start at a “consume” span, your context propagation is broken. Fixing this ensures you can trace a request from a button click in Chrome DevTools all the way through the API gateway, the backend service, the message queue, and the background worker.
Section 4: Infrastructure, Containers, and Best Practices
Microservices Debugging is not just about code; it’s about the environment. Docker Debugging and Kubernetes Debugging are essential skills. When a service crashes, is it a code error (OOM) or a Kubernetes limit (OOMKilled)?
Correlating Infrastructure with Application Logic
To debug effectively in Kubernetes, you must correlate traces with container logs. Ensure your logging format is JSON and includes the `trace_id`. This allows you to jump from a slow span in your tracing tool directly to the relevant logs in your logging aggregation system (like ELK or Loki).
Here is a Python example using the standard logging library to inject Trace IDs, facilitating Python Debugging in containerized environments:
import logging
from opentelemetry import trace

class TraceContextFilter(logging.Filter):
    def filter(self, record):
        # Get the current span
        span = trace.get_current_span()
        if span == trace.INVALID_SPAN:
            record.trace_id = 0
            record.span_id = 0
        else:
            ctx = span.get_span_context()
            record.trace_id = format(ctx.trace_id, "032x")
            record.span_id = format(ctx.span_id, "016x")
        return True

# Configure logging
logger = logging.getLogger(__name__)
handler = logging.StreamHandler()
formatter = logging.Formatter(
    '{"timestamp": "%(asctime)s", "level": "%(levelname)s", "trace_id": "%(trace_id)s", "message": "%(message)s"}'
)
handler.setFormatter(formatter)
logger.addFilter(TraceContextFilter())
logger.addHandler(handler)
logger.setLevel(logging.INFO)

# Now logs will automatically contain the trace ID for correlation
logger.info("Processing payment request")
Best Practices for Production Debugging
- Sampling Strategies: In high-throughput systems, tracing every request is too expensive. Use Head-based sampling (decide at the start) or Tail-based sampling (keep only traces with errors or high latency). This balances cost with Error Tracking visibility.
- Security and PII: Never log or trace Sensitive PII (Personally Identifiable Information) like passwords or credit card numbers. Use Static Analysis tools to ensure your instrumentation code sanitizes data before it leaves the application.
- Keep Libraries Updated: JavaScript Errors and Python Errors in instrumentation libraries can cause memory leaks. Regularly update your OTel agents and SDKs.
- Service Mesh: If you use Istio or Linkerd, leverage their built-in tracing capabilities to visualize network topology and debug mTLS or routing issues without touching application code.
Conclusion
Debugging microservices requires a paradigm shift from investigating single-process memory spaces to analyzing distributed transaction flows. By leveraging Distributed Tracing and OpenTelemetry, developers can illuminate the “black boxes” of their architecture. Whether you are focused on Node.js Development, Django Debugging, or Mobile Debugging, the principles remain the same: propagate context, correlate signals, and automate instrumentation.
Implementing these Debugging Best Practices transforms observability from a reactive “search and rescue” mission into a proactive strategy. It empowers teams to detect bottlenecks before they impact users, resolve Production Debugging incidents faster, and ultimately build more resilient software systems. Start by instrumenting your edge services, then work your way inward to databases and queues to achieve full system visibility.