Introduction
In the modern landscape of software engineering, the Continuous Integration and Continuous Deployment (CI/CD) pipeline is the heartbeat of delivery. However, it is also one of the most notoriously difficult environments to troubleshoot. We have all experienced the frustration of the “works on my machine” phenomenon, where a test suite passes locally but fails spectacularly within the CI environment. This discrepancy often leads to a cycle of “commit, push, pray,” resulting in commit histories littered with messages like “fix ci,” “try again,” and “debug logging.”
As development teams shift towards more complex architectures involving Microservices Debugging, Kubernetes, and serverless backends, the opacity of the CI environment becomes a critical bottleneck. The industry is slowly moving away from brittle, declarative YAML configurations toward “Pipelines as Code”—utilizing languages like TypeScript or Python to define workflows. This shift opens the door for superior CI/CD Debugging capabilities, allowing developers to apply standard Software Debugging principles to their infrastructure.
This article explores comprehensive strategies for debugging CI/CD pipelines. We will move beyond simple Error Tracking and explore how to leverage TypeScript Debugging for workflows, implement local emulation with Docker Debugging, and utilize advanced observability tools to illuminate the black box of remote execution.
Section 1: The Paradigm Shift – Debugging Pipelines as Code
One of the primary reasons CI/CD Debugging is difficult is the reliance on YAML. YAML is declarative, meaning you describe the desired state, but it lacks the logic, control structures, and debuggability of a real programming language. You cannot easily set breakpoints in a YAML file, nor can you perform Static Analysis to catch type errors before execution.
To solve this, many teams are adopting tools that allow pipelines to be written in TypeScript, Python, or Go. This approach treats the pipeline as software, enabling Unit Test Debugging and Code Analysis on the workflow logic itself. By defining workflows in TypeScript, for example, we gain the benefits of strong typing and IDE support, drastically reducing JavaScript Errors and configuration mismatches.
Consider a scenario where we need to conditionally deploy a microservice based on the branch name and commit message. In YAML, this requires complex bash scripting embedded in strings. In TypeScript, it is standard logic.
import { Pipeline, Job } from '@pipeline-sdk/core';

// A strongly-typed pipeline definition allows for compile-time debugging
// rather than runtime failure.

async function createDeploymentPipeline(branch: string, commitMsg: string) {
    const pipeline = new Pipeline('Backend-Deployment');

    // Logic is testable and debuggable locally
    const isProduction = branch === 'main';
    const skipTests = commitMsg.includes('[skip-tests]');

    if (!skipTests) {
        pipeline.addJob(new Job('Run-Unit-Tests', {
            image: 'node:18-alpine',
            commands: [
                'npm ci',
                'npm test -- --coverage' // Fail fast if coverage is low
            ]
        }));
    }

    if (isProduction) {
        // We can use standard TypeScript debugging to inspect this object construction
        pipeline.addJob(new Job('Deploy-Prod', {
            image: 'terraform:latest',
            env: {
                AWS_REGION: 'us-east-1',
                DEBUG_MODE: 'false'
            },
            commands: ['terraform apply -auto-approve']
        }));
    }

    return pipeline;
}

// We can unit test this function without running the actual CI
// verifying that logic holds before pushing code.
console.log(JSON.stringify(createDeploymentPipeline('main', 'feat: add logging'), null, 2));
In the example above, TypeScript Debugging tools can be used to step through the `createDeploymentPipeline` function. If there is a logic error in how jobs are added, it is caught locally. This approach aligns the Dev Ops workflow with standard Full Stack Debugging practices, making it accessible to developers familiar with JavaScript Development or Node.js Development.
The Role of Static Analysis
When pipelines are code, we can apply Static Analysis tools like ESLint or Pylint. These tools catch Node.js Errors and potential bugs (like using undefined variables) before the pipeline ever runs. This preemptive Bug Fixing saves hours of wait time associated with queuing CI jobs.
Section 2: Local Emulation and Docker Debugging
The golden rule of CI/CD Debugging is: “Don’t debug in production (or the CI runner) if you can debug locally.” The discrepancies between a local machine and a CI runner usually boil down to environment variables, file system paths, or missing dependencies. To bridge this gap, Docker Debugging is essential.
By encapsulating the build and test environment in a Docker container, you ensure that the environment running on your laptop is identical to the one running in the cloud. However, simply running `docker build` is often not enough. You need to interact with the container to perform Application Debugging.
Here is a Python script designed to emulate a CI step locally, allowing for Python Debugging within a containerized environment. It validates environment variables—a common source of Python Errors in CI—and executes the build command.
import os
import sys
import subprocess
import logging

# Configure logging to mimic CI output
logging.basicConfig(
    level=logging.INFO,
    format='%(asctime)s - [CI-EMULATOR] - %(levelname)s - %(message)s'
)

def validate_environment():
    """
    Checks for required CI environment variables.
    Common cause of failures: Missing secrets or config.
    """
    required_vars = ['DATABASE_URL', 'API_KEY', 'NODE_ENV']
    missing = [var for var in required_vars if not os.getenv(var)]

    if missing:
        logging.error(f"Missing environment variables: {', '.join(missing)}")
        logging.info("Tip: Use a .env file or export these variables before running.")
        return False
    return True

def run_build_step():
    """
    Runs the build command and captures output for analysis.
    """
    try:
        logging.info("Starting build process...")
        # Capture output to analyze stack traces if failure occurs
        result = subprocess.run(
            ['npm', 'run', 'build'],
            check=True,
            capture_output=True,
            text=True
        )
        logging.info("Build successful!")
        print(result.stdout)
    except subprocess.CalledProcessError as e:
        logging.error("Build Failed.")
        logging.error("STDERR Output (Stack Trace):")
        # Print the specific error for debugging
        print(e.stderr)
        sys.exit(1)

if __name__ == "__main__":
    logging.info("Starting Local CI Emulation")

    if not validate_environment():
        sys.exit(1)

    run_build_step()
This script can be mounted into a Docker container. If it fails, you can attach a shell to the running container (`docker exec -it
Utilizing “Act” for GitHub Actions
For those using GitHub Actions, tools like `act` allow you to run your workflows locally using Docker. This provides a feedback loop of seconds rather than minutes. It pulls the docker images defined in your YAML and executes the steps, allowing you to catch Stack Traces and Configuration Errors immediately on your machine.
Section 3: Advanced Observability and Remote Debugging
Sometimes, local emulation is insufficient. Issues related to network permissions, specific cloud credentials, or Kubernetes Debugging contexts only manifest in the actual CI environment. In these cases, we need advanced techniques like Remote Debugging and enhanced Observability.
Interactive Remote Debugging
Modern CI providers allow for interactive debugging. For example, in GitHub Actions, you can use tools like `tmate` to open an SSH session into the runner when a job fails. This allows you to perform live Linux Debugging inside the ephemeral runner.
However, relying on SSH is reactive. A proactive approach involves better logging. Standard logs are often unstructured text, making Log Analysis difficult. Implementing structured logging (JSON) in your scripts allows log aggregators to parse errors effectively.
Below is an example of a Node.js utility designed for CI environments that captures Network Debugging details and formats errors for observability tools. This is crucial for API Debugging when integration tests fail against external services.
const axios = require('axios');

// structured-logger.js
const logEvent = (level, message, context = {}) => {
    console.log(JSON.stringify({
        timestamp: new Date().toISOString(),
        level: level.toUpperCase(),
        message,
        ...context, // Spread context for searchable fields in Datadog/Splunk
        ci_job_id: process.env.GITHUB_RUN_ID || 'local'
    }));
};

async function runIntegrationTest() {
    const targetUrl = 'https://api.staging.example.com/health';

    try {
        logEvent('info', 'Starting integration test', { target: targetUrl });

        const response = await axios.get(targetUrl, { timeout: 5000 });

        logEvent('info', 'Health check passed', {
            status: response.status,
            latency: response.headers['x-response-time']
        });

    } catch (error) {
        // Detailed error breakdown for API Debugging
        const errorContext = {
            error_name: error.name,
            error_message: error.message,
            stack: error.stack
        };

        if (error.response) {
            // Server responded with a status code outside 2xx range
            errorContext.response_status = error.response.status;
            errorContext.response_data = error.response.data;
        } else if (error.request) {
            // Request was made but no response received (Network Debugging)
            errorContext.failure_type = 'NETWORK_TIMEOUT_OR_DNS';
        }

        logEvent('error', 'Integration test failed', errorContext);
        process.exit(1);
    }
}

runIntegrationTest();
By outputting JSON, you can feed these logs into Error Monitoring platforms. You can then query for specific failure types (e.g., `failure_type: “NETWORK_TIMEOUT_OR_DNS”`) across thousands of CI runs, revealing intermittent infrastructure issues that simple text logs would hide.
Debugging Performance Bottlenecks
Debug Performance is another critical aspect. If a CI pipeline takes 30 minutes, the feedback loop is too slow. Use Profiling Tools to analyze which steps take the longest. In the context of Node.js Debugging or Webpack builds, generating a flame graph or a build profile can reveal if time is being wasted on unnecessary transpilation or unoptimized dependencies.
Section 4: Best Practices for CI/CD Debugging
To maintain a healthy pipeline and minimize the need for emergency Bug Fixing, adopt these best practices:
1. Artifact Retention for Post-Mortem Analysis
When a pipeline fails, the runner is destroyed, taking all evidence with it. Configure your CI to upload artifacts (logs, screenshots from Selenium/Cypress tests, memory dumps) upon failure. This is vital for Frontend Debugging (e.g., React Debugging or Vue Debugging) where visual regression or DOM state is the culprit.
2. Fail Fast and Loud
Structure your pipeline to run the fastest checks first. Static Analysis and linting should run before unit tests, and unit tests before integration tests. If there is a syntax error, the pipeline should fail in seconds, not minutes. Use clear Error Messages; “Script failed with exit code 1” is useless. Wrap commands to output “Linting failed—check indentation” instead.
3. Isolate Dependencies
Dependency Hell is a frequent cause of CI failures. If your CI installs dependencies differently than your local machine (e.g., `npm install` vs `npm ci`), you will encounter issues. Always use lockfiles (`package-lock.json`, `poetry.lock`) to ensure deterministic builds. This falls under System Debugging—ensuring the system state is predictable.
4. Observability as Code
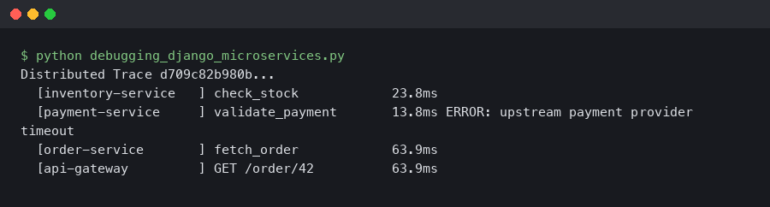
Just as you write infrastructure as code, write your observability configuration as code. Ensure that your CI scripts automatically inject correlation IDs into requests. This allows for Microservices Debugging where a failure in the CI integration test can be traced through the backend logs using a single ID.
Conclusion
CI/CD Debugging is no longer just about reading console output; it is a sophisticated engineering discipline involving Code Analysis, Container Debugging, and advanced Observability. By shifting from static YAML configurations to dynamic workflows using languages like TypeScript or Python, teams can leverage the full power of their development tools—including breakpoints, type checking, and unit tests—within their infrastructure logic.
Whether you are performing Backend Debugging on a Python API or Mobile Debugging for an iOS build, the principles remain the same: replicate the environment locally using Docker, enforce structured logging for better visibility, and treat your pipeline configuration with the same rigor as your production code. By mastering these techniques, you transform the CI pipeline from a source of frustration into a reliable, transparent backbone of your software delivery lifecycle.