
The Labyrinth of Modern Application Development: Navigating Microservices Debugging
Moving from monolithic architectures to microservices unlocks incredible scalability, flexibility, and team autonomy. However, this distributed paradigm introduces a new, formidable challenge: debugging. In a monolith, a stack trace could often pinpoint the exact line of code causing an issue. In a microservices ecosystem, a single user request can trigger a cascade of calls across dozens of independent services, each with its own logs, environment, and potential failure points. An issue that appears in one service might be a symptom of a root cause buried deep within another, turning debugging from a straightforward task into a complex distributed investigation.
Spending hours, or even days, tracing a single request through a maze of network calls, logs, and dashboards has become a common frustration for development and DevOps teams. The problem often isn’t a bug in a specific service’s logic but a subtle issue in the communication layer—latency, network policies, unexpected payloads, or version mismatches. This guide provides a comprehensive roadmap to mastering microservices debugging, moving beyond simple log-chasing to a holistic approach centered on modern observability, advanced tools, and best practices.
The Three Pillars of Observability: The Foundation of Effective Debugging
Before diving into advanced techniques, it’s crucial to establish a strong foundation. Effective microservices debugging isn’t about guesswork; it’s about making the system observable. Observability is built upon three core pillars: Logs, Metrics, and Traces. When used together, they provide a complete picture of your system’s health and behavior.
1. Centralized and Structured Logging
In a distributed system, logs from individual services are of limited use. The first step is to aggregate logs from all services into a centralized location using tools like the ELK Stack (Elasticsearch, Logstash, Kibana), Graylog, or Grafana Loki. More importantly, logs must be structured. Instead of plain text messages, log entries should be in a machine-readable format like JSON. This allows for powerful filtering, searching, and analysis.
A key practice is to include a Correlation ID (also known as a Request ID or Trace ID) in every log entry. This unique identifier is generated at the entry point of a request (e.g., an API gateway) and propagated through every subsequent service call. With a correlation ID, you can instantly filter logs from all services to see the entire lifecycle of a single request.
Here’s an example of setting up structured logging with a correlation ID in a Node.js Express application using the winston library.
const express = require('express');
const winston = require('winston');
const { v4: uuidv4 } = require('uuid');

// 1. Configure Winston for JSON structured logging
const logger = winston.createLogger({
  level: 'info',
  format: winston.format.json(),
  transports: [
    new winston.transports.Console(),
  ],
});

const app = express();

// 2. Middleware to add a correlation ID to each request
app.use((req, res, next) => {
  // Use existing header or generate a new one
  req.correlationId = req.headers['x-correlation-id'] || uuidv4();
  res.setHeader('x-correlation-id', req.correlationId);
  next();
});

app.get('/api/users/:id', (req, res) => {
  const correlationId = req.correlationId;
  const userId = req.params.id;

  // 3. Log with context, including the correlation ID
  logger.info('Fetching user data', {
    correlationId: correlationId,
    userId: userId,
    service: 'user-service'
  });

  // ... business logic to fetch user ...

  if (!user) {
    logger.error('User not found', {
      correlationId: correlationId,
      userId: userId,
      service: 'user-service'
    });
    return res.status(404).send('User not found');
  }

  logger.info('Successfully fetched user data', {
    correlationId: correlationId,
    userId: userId,
    service: 'user-service'
  });
  res.json(user);
});

app.listen(3000, () => {
  console.log('User service listening on port 3000');
});
2. Key Performance Metrics
Metrics are numerical representations of your system’s health over time. While logs tell you what happened during a specific event, metrics give you the broader context. Monitoring tools like Prometheus coupled with visualization platforms like Grafana are the industry standard. Key metrics to track for each microservice include:

- Latency (Request Duration): How long do requests take? Track averages and percentiles (p95, p99) to identify performance degradation.
- Traffic (Request Rate): The number of requests per second. Spikes or dips can indicate problems.
- Error Rate: The percentage of requests that result in errors (e.g., HTTP 5xx). A rising error rate is a clear signal of an issue.
- Saturation: How “full” your service is. This includes CPU utilization, memory usage, and database connection pools.
3. Distributed Tracing
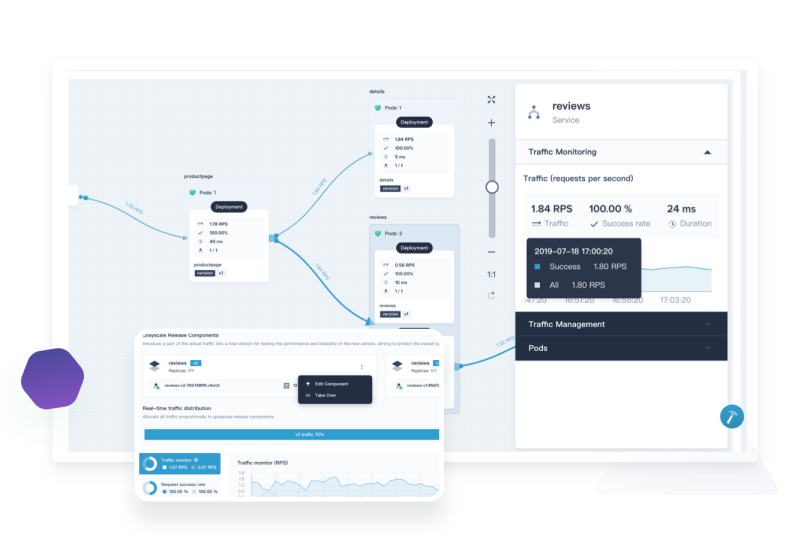
Tracing is the most powerful pillar for microservices debugging. It provides a complete, end-to-end view of a request as it travels through multiple services. A trace is a visualization of the entire request journey, composed of multiple spans. Each span represents a single unit of work within a service (e.g., an API call, a database query) and contains timing information and metadata.
Tools like Jaeger, Zipkin, and the vendor-neutral standard OpenTelemetry are essential for implementing distributed tracing. They help you visualize call graphs, identify bottlenecks, and understand the exact path a failing request took.
Implementing Distributed Tracing with OpenTelemetry
OpenTelemetry has emerged as the CNCF standard for observability, providing a unified set of APIs and libraries to collect traces, metrics, and logs. Implementing it involves instrumenting your code to create spans and propagate the trace context across service boundaries.
Let’s consider a scenario with two Python services: an `Order Service` that calls a `Payment Service`.
Step 1: Instrumenting the “Order Service” (Caller)
This service receives the initial request, creates a parent span, and then makes an HTTP call to the Payment Service, injecting the trace context into the headers.
# order_service.py
from flask import Flask, jsonify, request
import requests
from opentelemetry import trace
from opentelemetry.propagate import inject
from opentelemetry.sdk.trace import TracerProvider
from opentelemetry.sdk.trace.export import ConsoleSpanExporter, SimpleSpanProcessor

# --- OpenTelemetry Boilerplate Setup ---
provider = TracerProvider()
processor = SimpleSpanProcessor(ConsoleSpanExporter())
provider.add_span_processor(processor)
trace.set_tracer_provider(provider)
tracer = trace.get_tracer(__name__)
# --- End Setup ---

app = Flask(__name__)
PAYMENT_SERVICE_URL = "http://localhost:5001/process_payment"

@app.route("/create_order", methods=["POST"])
def create_order():
    # A new trace starts here for the incoming request
    with tracer.start_as_current_span("create_order_span") as span:
        order_data = request.json
        span.set_attribute("order.id", order_data.get("id"))

        print("Order Service: Received order creation request.")

        # Propagate the trace context to the downstream service
        headers = {}
        inject(headers) # Injects traceparent header, e.g., {'traceparent': '00-....-....-01'}

        try:
            # Call the Payment Service
            with tracer.start_as_current_span("call_payment_service_span") as child_span:
                child_span.set_attribute("http.method", "POST")
                child_span.set_attribute("http.url", PAYMENT_SERVICE_URL)

                response = requests.post(PAYMENT_SERVICE_URL, json=order_data, headers=headers)
                response.raise_for_status()

                child_span.set_attribute("http.status_code", response.status_code)

            print("Order Service: Payment successful.")
            return jsonify({"status": "Order Created", "payment_status": response.json()}), 201

        except requests.exceptions.RequestException as e:
            span.record_exception(e)
            span.set_status(trace.Status(trace.StatusCode.ERROR, "Payment service call failed"))
            print(f"Order Service: Error calling payment service: {e}")
            return jsonify({"error": "Payment failed"}), 500

if __name__ == "__main__":
    app.run(port=5000)
Step 2: Instrumenting the “Payment Service” (Callee)
This service extracts the trace context from the incoming request headers and creates a child span, linking it to the parent span from the Order Service.
# payment_service.py
from flask import Flask, jsonify, request
from opentelemetry import trace, propagate
from opentelemetry.sdk.trace import TracerProvider
from opentelemetry.sdk.trace.export import ConsoleSpanExporter, SimpleSpanProcessor

# --- OpenTelemetry Boilerplate Setup (same as other service) ---
provider = TracerProvider()
processor = SimpleSpanProcessor(ConsoleSpanExporter())
provider.add_span_processor(processor)
trace.set_tracer_provider(provider)
tracer = trace.get_tracer(__name__)
# --- End Setup ---

app = Flask(__name__)

@app.route("/process_payment", methods=["POST"])
def process_payment():
    # Extract the context from the incoming request headers
    context = propagate.extract(request.headers)

    # Create a child span linked to the parent from the Order Service
    with tracer.start_as_current_span("process_payment_span", context=context) as span:
        payment_data = request.json
        order_id = payment_data.get("id")
        span.set_attribute("order.id", order_id)

        print(f"Payment Service: Processing payment for order {order_id}")

        # Simulate payment processing logic
        if order_id % 2 == 0:
             span.set_attribute("payment.status", "success")
             print(f"Payment Service: Payment successful for order {order_id}")
             return jsonify({"status": "Payment Approved"}), 200
        else:
             span.set_attribute("payment.status", "failed")
             span.set_status(trace.Status(trace.StatusCode.ERROR, "Insufficient funds"))
             print(f"Payment Service: Payment failed for order {order_id}")
             return jsonify({"status": "Payment Declined"}), 400

if __name__ == "__main__":
    app.run(port=5001)
When you run these two services and send a request to the Order Service, the console exporters will print the trace data. In a real system, this data would be sent to a backend like Jaeger, where you could see a unified trace showing the full request flow, including timings for each span.
Advanced Debugging with Service Meshes and Production Tools
While manual instrumentation is powerful, it requires code changes. For a more transparent approach, especially for network-level issues, a service mesh is invaluable.
Service Mesh for Transparent Observability
A service mesh like Istio or Linkerd works by deploying a “sidecar” proxy (like Envoy) alongside each of your microservice instances. This proxy intercepts all incoming and outgoing network traffic. Because the mesh controls the network, it can automatically generate metrics, logs, and distributed traces for all traffic between services without you having to modify a single line of application code.
For example, to enable tracing in Istio for a specific namespace, you would typically configure a `Telemetry` API resource. The mesh handles the trace context propagation and span generation automatically.
apiVersion: telemetry.istio.io/v1alpha1
kind: Telemetry
metadata:
  name: mesh-default-tracing
  namespace: istio-system
spec:
  tracing:
  - providers:
    - name: "zipkin" # Or jaeger, etc.
    randomSamplingPercentage: 100.0
This approach is excellent for getting baseline observability and debugging network-related problems like retries, timeouts, and mTLS security policies.
Remote and Production Debugging
Sometimes, issues only appear in production. Debugging in a live environment is risky, but modern tools and techniques can make it safer:
- Feature Flags: Wrap new or problematic code in a feature flag. This allows you to enable or disable the code path in real-time for specific users or requests without a redeployment, helping you isolate issues safely.
- Dynamic Instrumentation: Tools like Rookout or Lightrun allow you to inject non-breaking logs and capture application snapshots from running production code on-demand, without stopping the application or changing the code. This is a powerful form of remote debugging.
- Canary Deployments: Gradually roll out a new version of a service to a small subset of users. By monitoring the error rates and performance of the canary group, you can catch bugs before they impact your entire user base.
Best Practices for a Debuggable Microservices Architecture
Building a system that is easy to debug requires a proactive and disciplined approach. It’s not just about tools, but also about culture and design.
- Standardize Everything: Use a common framework for logging, metrics, and tracing across all services. This consistency makes it much easier for developers to understand and analyze data from different parts of the system.
- Embrace Correlation IDs as a First-Class Citizen: Ensure that every API gateway, message queue, and service-to-service call propagates the correlation ID. It is the single most important piece of data for tying the system together.
- Design for Failure: Use patterns like circuit breakers, retries with exponential backoff, and timeouts. Your observability data will show you when these patterns are triggered, giving you insight into transient failures and service instability.
- Invest in Developer Tooling: Simplify the local development experience. Tools like Docker Compose help run a multi-service stack locally. For more complex Kubernetes environments, tools like Telepresence allow you to connect your local machine to a remote cluster, enabling you to debug a single service locally while it interacts with other services in the cluster.
- Foster a Culture of Observability: Encourage teams to build dashboards, set up alerts, and consult observability data *before* an incident occurs. Treat observability as a feature of your product, not an afterthought.
Conclusion: From Reactive to Proactive Debugging
Debugging microservices is fundamentally different from debugging a monolith. It requires a shift in mindset from inspecting a single process to observing a complex, distributed system. By embracing the three pillars of observability—logs, metrics, and traces—you can transform debugging from a reactive, frustrating hunt into a proactive, data-driven investigation.
Start by establishing a foundation of centralized, structured logging with correlation IDs. Then, layer on distributed tracing with OpenTelemetry to gain end-to-end visibility into your request flows. Finally, explore advanced tools like service meshes and safe production debugging techniques to handle the most complex scenarios. By investing in these tools and practices, you can tame the complexity of your microservices architecture, reduce your mean time to resolution (MTTR), and empower your teams to build more resilient and reliable applications.