

The Developer’s Guide to Modern Angular Debugging
Debugging is an inevitable and essential part of the software development lifecycle. For developers working with a sophisticated framework like Angular, understanding how to efficiently diagnose and resolve issues is the key to building robust, high-performance applications. While `console.log` has long been a trusty sidekick, the modern Angular ecosystem, supercharged by the Ivy compiler, offers a far more powerful and intuitive suite of debugging tools and techniques. Moving beyond simple log statements allows for a deeper understanding of application state, component interaction, and performance bottlenecks.
This comprehensive guide will take you on a journey from foundational browser-based techniques to advanced, Angular-specific strategies. We’ll explore how to leverage browser DevTools effectively, unlock the hidden power of Angular’s global debug object, tackle the complexities of asynchronous RxJS streams, and adopt best practices that make your codebase inherently easier to debug. Whether you’re fixing a stubborn bug or optimizing your application’s performance, mastering these debugging techniques will make you a more effective and confident Angular developer. This article provides actionable insights into frontend debugging, code debugging, and the specific challenges of TypeScript debugging within the Angular framework.
The Foundation: Mastering Browser DevTools for Angular Applications
Before diving into Angular-specific tools, it’s crucial to have a solid grasp of the debugging features built directly into modern web browsers. Chrome DevTools, Firefox Developer Tools, and others provide the bedrock for any web debugging effort, and understanding how they interact with an Angular application is the first step toward mastery.
Source Maps and the `debugger` Statement
Angular applications are written in TypeScript, but browsers execute JavaScript. This is where source maps become indispensable. A source map is a file that maps the compiled, often minified JavaScript code back to the original TypeScript source. When you enable source maps in your `angular.json` configuration (they are on by default in development mode), the browser’s debugger can show you your original, readable TypeScript code, not the generated JavaScript. This makes TypeScript debugging a seamless experience.
One of the most direct ways to pause your application’s execution and inspect its state is with the `debugger;` statement. Placing this keyword in your code will automatically trigger a breakpoint when the browser’s DevTools are open. This allows you to examine the call stack, inspect the values of local variables, and step through your code line by line.
import { Component, OnInit } from '@angular/core';
import { UserService } from '../user.service';

@Component({
  selector: 'app-user-profile',
  templateUrl: './user-profile.component.html',
})
export class UserProfileComponent implements OnInit {
  user: any;
  isLoading = true;

  constructor(private userService: UserService) {}

  ngOnInit(): void {
    this.loadUserData(123);
  }

  loadUserData(userId: number): void {
    this.userService.getUser(userId).subscribe(data => {
      this.user = data;
      this.processPermissions();
      this.isLoading = false;
    });
  }

  processPermissions(): void {
    // Let's say we have a complex permissions issue.
    // We can pause execution right here to inspect the user object.
    console.log('Pausing to inspect user permissions...');
    debugger; // Execution will halt here if DevTools is open.

    if (this.user.permissions.includes('admin')) {
      // ... complex logic
    }
  }
}
With the `debugger;` statement in place, you can explore the `this.user` object in the `Scope` panel of DevTools, verify its structure, and understand why your permission logic might be failing. This is a fundamental technique in application debugging.
Beyond `console.log`: Advanced Console Techniques
While `console.log()` is ubiquitous, the debug console offers much more. Overusing `console.log` can lead to a cluttered console and requires recompilation for every change. To improve your logging and debugging workflow, consider these powerful alternatives:
- Object Shorthand: Instead of `console.log(‘myVariable: ‘, myVariable)`, use `console.log({ myVariable })`. This prints the variable’s name and value, making your logs much easier to read.
- `console.table()`: When dealing with arrays of objects, `console.table()` renders the data in a clean, sortable table format, which is excellent for inspecting API responses.
- `console.trace()`: If you need to understand how a particular function was called, `console.trace()` will output the current call stack, showing the path the code took to reach that point.
// Inside a component method
const users = [
  { id: 1, name: 'Alice', role: 'Admin' },
  { id: 2, name: 'Bob', role: 'Editor' },
  { id: 3, name: 'Charlie', role: 'Viewer' }
];
const currentUser = users[0];

// Good: Use object shorthand for clarity
console.log({ currentUser });
// Output: { currentUser: { id: 1, name: 'Alice', role: 'Admin' } }

// Better: Use console.table for arrays of objects
console.table(users);
// Renders a beautiful, interactive table in the console

// Best for tracing execution flow
function processUser() {
  // ... some logic
  logUserAction();
}

function logUserAction() {
  // Find out how we got here
  console.trace('User action logged from:');
}

processUser();
Unlocking Angular’s Built-in Debugging APIs
With the advent of the Ivy compiler, Angular introduced a set of global debugging utilities accessible directly from the browser console in development mode. These tools provide an unprecedented level of access to your application’s components and state, enabling powerful live debugging and dynamic analysis without ever leaving the browser.
The Power of `ng` in the Browser Console
In development builds, Angular exposes a global object named `ng`. This object is your gateway to interacting with your application’s internals. The most common workflow involves using the Elements panel in DevTools to inspect the DOM.
- Select an Element: In the Elements panel, click on a custom component tag (e.g., `
`). - Access in Console: The browser makes the currently selected element available via the `$0` variable in the console.
- Get the Component Instance: Use the `ng.getComponent()` method to retrieve the component instance associated with that DOM element.
Once you have the component instance, you can inspect its properties, view its state, and even execute its methods directly from the console. This is an incredibly powerful feature for web debugging.
// 1. In Chrome DevTools, go to the 'Elements' tab.
// 2. Click on an Angular component tag, for example: <app-user-profile>
// 3. Go to the 'Console' tab and type the following commands:

// Get the component instance tied to the selected DOM element ($0)
const myComponent = ng.getComponent($0);

// Now you can inspect its properties
console.log('Current user:', myComponent.user);

// You can even call methods on the component instance
myComponent.loadUserData(456);
// This will trigger the method and re-fetch data for a different user.

// You can also access its dependencies, like injected services
const userServiceInstance = myComponent.userService;
console.log({ userServiceInstance });
Manipulating State and Triggering Change Detection
Inspecting state is useful, but what if you want to change it? With the component instance in hand, you can modify its properties directly. For example, you could test how the UI reacts to a user’s name being exceptionally long or a flag being set to an unexpected value.
However, after changing a property from the console, you’ll notice the UI doesn’t update automatically. This is because Angular’s change detection mechanism hasn’t been triggered. The `ng` object has a solution for this: `ng.applyChanges()`. This function takes a component instance as an argument and manually runs change detection on it and its children, causing the view to update with your modified data.
This technique is fantastic for quickly testing edge cases in your UI without having to modify your code and wait for the application to recompile.
Advanced Angular Debugging Strategies
As applications grow in complexity, so do the bugs. Simple synchronous issues are one thing, but modern Angular apps are rich with asynchronous operations, complex state management, and performance considerations. This section covers advanced tools and techniques to tackle these challenges.
Debugging RxJS Observables with the `tap` Operator
One of the most common challenges in Angular debugging is understanding the flow of data through RxJS Observables. A long chain of operators (`pipe`, `map`, `filter`, `switchMap`) can make it difficult to see what the data looks like at each stage. Placing a `console.log` inside the final `subscribe` block only shows you the end result, not the journey.
The solution is the `tap` operator. `tap` allows you to perform a side effect—like logging to the console—for each emission in an Observable stream without modifying the stream itself. It’s the perfect tool for async debugging and API debugging.
import { HttpClient } from '@angular/common/http';
import { Injectable } from '@angular/core';
import { Observable } from 'rxjs';
import { map, filter, tap } from 'rxjs/operators';

interface User {
  id: number;
  name: string;
  email: string;
  isActive: boolean;
}

@Injectable({ providedIn: 'root' })
export class DataService {
  constructor(private http: HttpClient) {}

  getActiveUsers(): Observable<User[]> {
    return this.http.get<User[]>('/api/users').pipe(
      // Tap 1: See the raw API response
      tap(users => console.log('Raw API response:', users)),

      // Filter out inactive users
      map(users => users.filter(user => user.isActive)),

      // Tap 2: See the data after filtering
      tap(activeUsers => console.log('After filtering for active users:', activeUsers)),

      // Map to just get the user names
      map(activeUsers => activeUsers.map(user => user.name)),

      // Tap 3: See the final data before it's delivered to the subscriber
      tap(userNames => console.log('Final data (user names):', userNames))
    );
  }
}
Using the Angular DevTools Extension
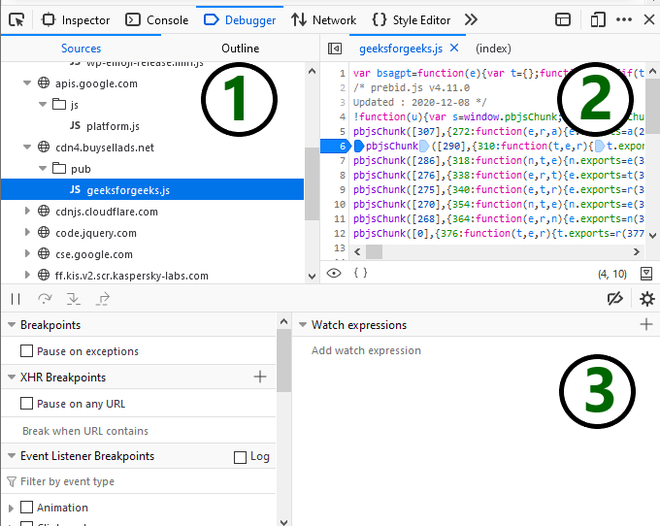
The official Angular DevTools for Chrome and Firefox is a must-have extension that significantly enhances the debugging experience. It provides two main features:
- Component Explorer: This gives you a tree view of your application’s component structure, mirroring the DOM but showing your component hierarchy. You can select a component from the tree to inspect its properties, inputs, and outputs in a dedicated panel. It’s a much more streamlined way to do what `ng.getComponent($0)` does.
- Profiler: This is an invaluable tool for performance monitoring and debugging. The profiler records your application’s runtime performance, focusing specifically on change detection. It visualizes how much time Angular spends in each component, helping you identify performance bottlenecks and components that are re-rendering too frequently. This is essential for serious debug performance analysis.
Using these developer tools can turn a frustrating hunt for a bug or a performance issue into a structured investigation.
Best Practices for a Debug-Friendly Angular Application
The most effective debugging strategy is to write code that is less prone to bugs in the first place. By following certain best practices, you can create a codebase that is more predictable, testable, and transparent, drastically reducing the time you spend hunting down issues.
Writing Clean, Testable Code
Proactive bug prevention is always better than reactive bug fixing. A solid suite of unit and integration tests is your first line of defense. When you practice testing and debugging together, you can isolate component logic and services, verifying their behavior under various conditions. This approach, often called unit test debugging, catches errors long before they manifest as visual glitches in the browser. Keep components small and focused on a single responsibility to make them easier to test and reason about.
Leveraging TypeScript’s Type System
Don’t underestimate the power of TypeScript as a debugging tool. A strong type system is a form of static analysis that can eliminate entire classes of runtime errors. Enable strict mode (`”strict”: true`) in your `tsconfig.json` to enforce stricter type checking, including null and undefined checks. This prevents common JavaScript errors like “Cannot read property ‘x’ of undefined,” saving you countless hours of runtime debugging.
Implement an Effective Logging Strategy
While `console.log` is fine for quick checks, a more structured approach to logging and debugging is beneficial for larger applications. Consider creating a custom `LoggingService` that can be configured based on the environment. This service can add valuable context to your messages, such as timestamps, component names, and severity levels (e.g., INFO, WARN, ERROR). In production, this service can be configured to send critical error messages to an error tracking service like Sentry or Datadog for robust production debugging and error monitoring.
Conclusion: Becoming a Debugging Expert
Mastering Angular debugging is a journey that transforms you from a developer who simply fixes bugs to one who deeply understands the application’s inner workings. By combining the foundational power of browser DevTools with Angular’s modern, Ivy-powered debugging APIs, you can dissect component state and behavior with surgical precision. Advanced techniques, such as using the RxJS `tap` operator and the Angular DevTools extension, equip you to handle the complexities of asynchronous code and performance optimization.
Ultimately, the most powerful strategy is a proactive one. By writing clean, testable code, leveraging TypeScript’s full potential, and implementing a smart logging strategy, you build a resilient application that is inherently easier to maintain and debug. Embrace these tools and practices, and you’ll spend less time fixing problems and more time building incredible user experiences.