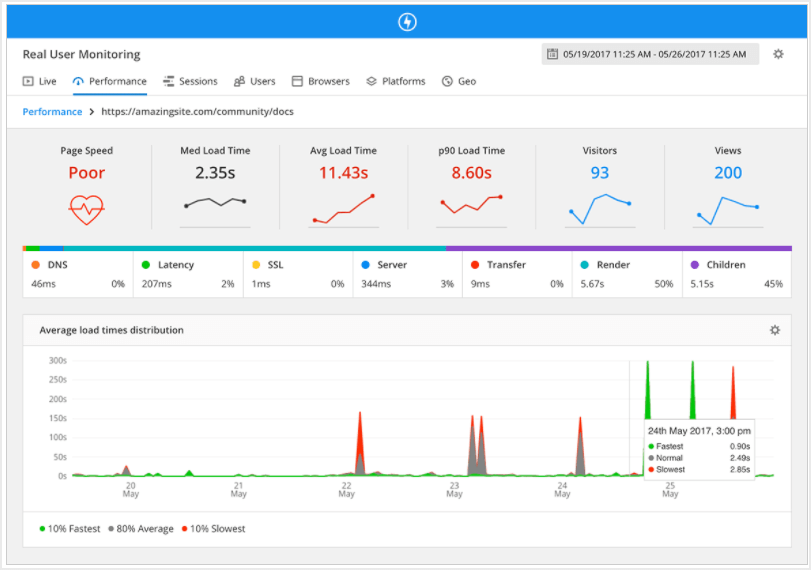
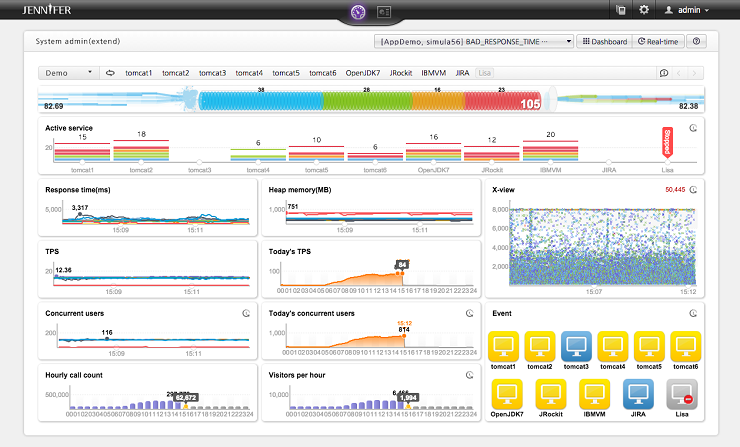
In the modern landscape of software development, writing code that functions correctly is merely the baseline. The true differentiator between a functional prototype and a production-grade enterprise application often lies in performance. This is where profiling tools become indispensable. While standard software debugging focuses on fixing logic errors and squashing bugs, profiling focuses on the efficiency of resource consumption—specifically CPU cycles, memory usage, network bandwidth, and I/O operations.
Many developers rely on intuition to guess where bottlenecks lie, a practice often referred to as “premature optimization.” However, without concrete data, these guesses are frequently wrong. A comprehensive profiling strategy allows developers to visualize the runtime behavior of their application, transforming opaque performance issues into actionable data. Whether you are engaged in Node.js development, Python development, or optimizing complex frontend interfaces, understanding how to leverage profiling tools is a critical skill set.
This article delves deep into the ecosystem of profiling tools, exploring debugging techniques, memory management, and performance monitoring. We will examine how to implement profiling in various environments, from backend API development to React debugging, ensuring your applications run smoothly under load.
Core Concepts: CPU Profiling and Statistical Analysis
At its heart, profiling is the dynamic analysis of a program. Unlike static analysis, which looks at code structure without executing it, profiling measures the code while it runs. The most common starting point is CPU profiling. CPU profilers generally fall into two categories: deterministic (tracing) and statistical (sampling).
Deterministic vs. Statistical Profiling
Deterministic profilers monitor every function call, function return, and exception. This provides exact data but introduces significant overhead, potentially skewing results by making the application run much slower than normal. Statistical profilers, conversely, interrupt the CPU at regular intervals (samples) to record which function is currently executing. This is less intrusive and better suited for production debugging, though it may miss short-lived function calls.
Let’s look at a practical example using Python debugging tools. Python comes with a built-in deterministic profiler called cProfile. It is robust and excellent for identifying algorithmic inefficiencies in backend scripts.
Below is an example of how to profile a recursive function versus an iterative one to analyze performance differences:

import cProfile
import pstats
import io

def fibonacci_recursive(n):
    if n <= 1:
        return n
    return fibonacci_recursive(n-1) + fibonacci_recursive(n-2)

def fibonacci_iterative(n):
    a, b = 0, 1
    for _ in range(n):
        a, b = b, a + b
    return a

def main_driver():
    print("Starting Profiling Session...")
    # Intentionally causing work to measure CPU time
    print(f"Recursive Result: {fibonacci_recursive(30)}")
    print(f"Iterative Result: {fibonacci_iterative(30)}")

if __name__ == "__main__":
    # Initialize the profiler
    pr = cProfile.Profile()
    pr.enable()

    main_driver()

    pr.disable()

    # Format and print the stats
    s = io.StringIO()
    sortby = 'cumulative'
    ps = pstats.Stats(pr, stream=s).sort_stats(sortby)
    ps.print_stats()

    print(s.getvalue())
In the output of this script, you will see columns for ncalls (number of calls), tottime (total time spent in the given function excluding sub-calls), and cumtime (cumulative time spent in this and all sub-functions). This distinction is vital for code debugging. If a function has a high cumtime but low tottime, it means it is waiting on children functions. If tottime is high, the function itself is the bottleneck.
Implementation: Memory Profiling and Leak Detection
While CPU spikes slow down an application, memory leaks crash them. Memory debugging is the process of analyzing the heap—the region of memory where objects are stored. In languages with Garbage Collection (GC) like JavaScript, Java, or Python, memory leaks occur when objects are unintentionally referenced, preventing the GC from reclaiming that space.
In Node.js development, memory leaks are a common source of instability. A typical culprit is the improper use of closures or global variables that grow indefinitely. Tools like Chrome DevTools (which can attach to Node instances) or programmatic heap snapshots are essential here.
Programmatic Memory Tracking in Node.js
Sometimes you cannot attach a GUI debugger, especially in containerized environments like Docker debugging or Kubernetes debugging scenarios. In these cases, you need to log memory usage programmatically to identify trends.
const fs = require('fs');

// Simulate a memory leak
const leakyBucket = [];

function simulateTraffic() {
    // Creating objects that are never garbage collected
    const data = {
        id: Date.now(),
        payload: new Array(10000).fill('X').join(''),
        timestamp: new Date()
    };
    leakyBucket.push(data);
}

function logMemoryUsage() {
    const used = process.memoryUsage();

    // Log memory metrics in MB
    const logEntry = {
        rss: `${Math.round(used.rss / 1024 / 1024 * 100) / 100} MB`,
        heapTotal: `${Math.round(used.heapTotal / 1024 / 1024 * 100) / 100} MB`,
        heapUsed: `${Math.round(used.heapUsed / 1024 / 1024 * 100) / 100} MB`,
        external: `${Math.round(used.external / 1024 / 1024 * 100) / 100} MB`,
    };

    console.table(logEntry);

    // In a real app, you might trigger a heap dump if heapUsed > threshold
    if (used.heapUsed > 200 * 1024 * 1024) { // 200MB limit
        console.warn('CRITICAL: High Memory Usage Detected');
        // require('v8-profiler').writeSnapshot(...) // Hypothetical implementation
    }
}

// Run simulation
setInterval(() => {
    simulateTraffic();
    logMemoryUsage();
}, 1000);
This script demonstrates how to monitor the Resident Set Size (RSS) and Heap usage. If heapUsed consistently climbs without dropping (which would indicate a GC event), you have a leak. This approach is fundamental to backend debugging and ensuring stability in long-running processes.
Advanced Techniques: Frontend Performance and React Profiler
Frontend debugging has evolved significantly. Modern Single Page Applications (SPAs) built with frameworks like React, Vue, or Angular can suffer from unnecessary re-renders, causing UI lag. React debugging specifically benefits from the React DevTools Profiler, but you can also instrument profiling programmatically within your codebase to catch regressions in production.
The React <Profiler> API allows you to measure the "cost" of rendering a specific part of the component tree. This is incredibly useful for identifying which components are slow to mount or update.

import React, { Profiler, useState } from 'react';
// Callback function to handle profiling data
const onRenderCallback = (
id, // the "id" prop of the Profiler tree that has just committed
phase, // either "mount" (if the tree just mounted) or "update" (if it re-rendered)
actualDuration, // time spent rendering the committed update
baseDuration, // estimated time to render the entire subtree without memoization
startTime, // when React began rendering this update
commitTime, // when React committed this update
interactions // the Set of interactions belonging to this update
) => {
// Filter out fast renders to reduce noise
if (actualDuration > 10) {
console.log(`[Profiler] ${id} (${phase}) took ${actualDuration.toFixed(2)}ms`);
// In a real scenario, send this to an error tracking service
// sendToAnalytics({ id, phase, duration: actualDuration });
}
};
const HeavyComponent = () => {
// Simulating heavy computation
const data = new Array(5000).fill(0).map((_, i) => Item {i});
return {data};
};
export default function App() {
const [count, setCount] = useState(0);
return (
{/* Wrap the suspected slow component in a Profiler */}
);
}By wrapping components in the Profiler, you gain visibility into the Render Phase and Commit Phase. This is a powerful form of dynamic analysis that helps developers decide where to apply memoization (React.memo, useMemo) to prevent wasted render cycles.
Best Practices and Optimization Strategies
Effective profiling requires more than just running a tool; it requires a methodology. Here are key best practices for performance monitoring and application debugging.
1. Profile in the Correct Environment
Never profile a development build for performance metrics. Development builds in frameworks like React or Vue include extra warnings, validation checks, and unminified code that significantly skew results. Always profile a production build, even if you are doing it locally. For web debugging, ensure you are not throttling the CPU in Chrome DevTools unless you are specifically testing for low-end devices.
2. Use Flame Graphs for Visualization
Raw text logs of stack traces can be overwhelming. Flame graphs visualize the call stack, where the x-axis represents time (or population) and the y-axis represents stack depth. A wide bar indicates a function that took a long time to execute. Tools like py-spy for Python or the "Performance" tab in Chrome DevTools generate these automatically. They allow you to instantly spot "hot paths" in your code.
3. Remote Profiling and APM
For microservices debugging and full stack debugging, you often cannot reproduce the bug locally. This is where Application Performance Monitoring (APM) tools (like Datadog, New Relic, or Sentry) come in. They provide continuous profiling in production with low overhead. However, for a lightweight, custom approach in Python, you might use a decorator to log execution time only when needed:
import time
import functools
import logging

# Configure logging
logging.basicConfig(level=logging.INFO)
logger = logging.getLogger(__name__)

def time_execution(func):
    """Decorator to measure execution time of a function."""
    @functools.wraps(func)
    def wrapper(*args, **kwargs):
        start_time = time.time()
        try:
            result = func(*args, **kwargs)
            return result
        finally:
            end_time = time.time()
            duration = (end_time - start_time) * 1000
            logger.info(f"Function '{func.__name__}' took {duration:.2f} ms")
    return wrapper

@time_execution
def process_data_batch(data):
    # Simulate processing
    time.sleep(0.1)
    return [d * 2 for d in data]

# Usage
process_data_batch([1, 2, 3, 4, 5])
This technique allows for logging and debugging specific critical paths without the overhead of a full profiler, making it suitable for integration debugging.
Conclusion
Profiling is not just a reactive measure for fixing bugs; it is a proactive discipline for software quality assurance. From using cProfile for Python errors and bottlenecks, to tracking memory leaks in Node.js development, and optimizing UI with React debugging tools, the ability to measure performance accurately is what separates senior developers from the rest.
As applications grow in complexity—spanning microservices, mobile debugging, and cloud infrastructure—the reliance on robust profiling tools and error monitoring strategies will only increase. Remember the golden rule of performance engineering: measure twice, cut once. Do not optimize based on assumptions; optimize based on the irrefutable evidence provided by your profiling data.


