I spent three hours yesterday staring at a silent failure in a Jinja2 template. You know the drill. The page renders, no 500 error pops up, but the data just isn’t there. Or worse, it’s there, but formatted weirdly because a list comprehension in the view function silently dropped a key item.
Debugging Flask applications usually falls into two buckets: the Python side, where we have excellent tools like pdb or IDE breakpoints, and the template side, which often feels like a black box. I’ve lost count of how many times I’ve resorted to sticking {{ variable }} all over my HTML just to see what’s going on. It feels primitive. It feels wrong.
I want to talk about a better approach I’ve been using lately: expression tracing. This isn’t just about pausing execution; it’s about tracking data as it flows through those hard-to-reach places like Jinja2 templates, lambdas, and complex list comprehensions. If you are doing serious Flask Debugging in 2025, you need to move beyond simple print statements.
The Gap in Standard Python Debugging
Standard debugging tools have a blind spot. They excel at statement-level debugging but struggle with expression-level debugging. If you have a complex line of code—say, a functional chain or a nested list comprehension—a standard debugger steps over the whole line. You see the before and after, but not the chaotic middle.
In Flask, this issue is compounded because a lot of logic ends up in the template or in concise view functions designed to return JSON quickly. When I run into an issue with a lambda function inside a filter, I can’t easily break inside that lambda.
Here is my strategy for cracking open these opaque boxes.
Tracing Jinja2 Templates
Jinja2 is notoriously difficult to debug because it compiles down to Python code that doesn’t map 1-to-1 with your source file in a way that standard debuggers like. My go-to method for fixing this involves injecting a custom “spy” capability directly into the template context.
I stop guessing what context is being passed to my template. Instead, I use a pass-through filter. This is a simple Python function that logs the value it receives and then returns it unmodified. It allows you to inspect data flow in the middle of a render operation without breaking the page layout.
Here is how I set this up in my Flask application factory:
import logging
from flask import Flask

# Configure logging to print to console
logging.basicConfig(level=logging.DEBUG)
logger = logging.getLogger(__name__)

def create_app():
    app = Flask(__name__)

    @app.template_filter('debug_trace')
    def debug_trace_filter(value, label="TRACE"):
        """
        Logs the value and type, then returns the value unchanged.
        Usage in Jinja: {{ my_variable | debug_trace('CHECKING_VAR') }}
        """
        logger.debug(f"[{label}] Type: {type(value)} | Value: {value}")
        return value

    return app
Now, inside your HTML template, you can use this filter anywhere. If you have a complex loop or a conditional that isn’t behaving, you wrap the variable in the pipe.
{% for item in items | debug_trace('LOOP_START') %}
- {{ item.name }} - {{ item.price | debug_trace('PRICE_CHECK') }}
{% endfor %}
I find this infinitely more useful than just printing to the browser window. It keeps your UI clean while your terminal fills up with structured, readable data about exactly what Jinja is processing. This is a fundamental Web Debugging technique that saves me hours.

Debugging Complex List Comprehensions
Another area where I see developers (and myself) struggle is with “pythonic” one-liners. We love writing list comprehensions because they are concise, but they are a nightmare for Code Debugging when they go wrong.
Imagine you have this logic in your Flask view:
@app.route('/api/process-data')
def process_data():
    raw_data = get_external_data()
    # Complex transformation
    results = [x['value'] * 2 for x in raw_data if x['active'] and validate(x['id'])]
    return {"data": results}
If results comes back empty, why? Is raw_data empty? Is the active flag false? Did validate() fail? A breakpoint on this line only tells you the result. It doesn’t tell you which condition failed for which item.
I solve this by wrapping the iterable or the condition in a tracer. I built a small utility class that I import into my projects for this exact purpose. It acts like a wrapper that logs every interaction.
class ExpressionTracer:
    def __init__(self, label="EXPR"):
        self.label = label

    def trace(self, value, meta=""):
        print(f"[{self.label}] {meta} -> {value}")
        return value

    def check(self, condition, meta=""):
        print(f"[{self.label}] Condition {meta} -> {bool(condition)}")
        return condition

# Usage in the view
tracer = ExpressionTracer("DATA_PROCESS")

results = [
    tracer.trace(x['value'] * 2, "calc")
    for x in raw_data
    if tracer.check(x['active'], "is_active") and tracer.check(validate(x['id']), "valid_id")
]
This looks verbose, and I wouldn’t leave it in production code, but for Backend Debugging during development, it is unbeatable. You get a line-by-line readout of the comprehension’s internal logic. You can see exactly which item failed the validation check without breaking the flow of the application.
Tracing Lambdas and Method Chains
I run into similar issues with method chaining, often when using ORMs like SQLAlchemy or data manipulation libraries like Pandas within a Flask route. You have a chain of .filter().map().reduce() and somewhere in the middle, data gets corrupted.
Standard Error Tracking tools will give you the stack trace if an exception is raised, but they won’t help if the logic is just silently incorrect. I use a technique here that I call “The Interceptor.”
If you are chaining methods on an object you control, you can add a debug() method that simply prints self and returns self. But often we are using third-party objects. In those cases, I use a wrapper function similar to the list comprehension tracer.
For lambdas, it’s tricky. You can’t easily insert a print statement into a lambda because a lambda must be a single expression. However, you can insert a side-effect function that returns the value. This is a neat Python Debugging trick.
def spy(val):
    print(f"DEBUG SPY: {val}")
    return val

# A lambda that is hard to debug
clean_data = map(lambda x: x.strip().upper(), input_list)

# Debugging the lambda by injecting the spy
# The spy prints the result of upper() before passing it along
clean_data = map(lambda x: spy(x.strip().upper()), input_list)
This allows you to verify the output of anonymous functions without converting them to full def functions just to add logging.
Handling Asynchronous Flask Routes
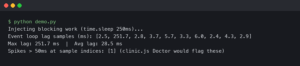
Async Debugging introduces another layer of complexity. With Flask 2.x and 3.x supporting async routes, I’m writing more await calls in my views. The execution flow isn’t always linear, and tracking context across await boundaries can be frustrating.

When debugging async routes, I ensure that my logging includes thread or task identifiers. Standard logging in Python can do this, but you have to configure it. If you don’t, your logs from different requests will interleave, making it impossible to trace a single request’s journey.
import logging
import asyncio

# Add %(threadName)s or asyncio task info to your format
logging.basicConfig(
    format='%(asctime)s [%(threadName)s] %(message)s',
    level=logging.DEBUG
)

@app.route('/async-data')
async def async_data():
    logger.debug("Starting async request")
    data = await fetch_remote_data()
    logger.debug(f"Data received: {len(data)}")
    return {"count": len(data)}
I also recommend using a request ID. I usually attach a unique ID to the Flask g object at the start of a request and include it in every log message. This is essential for Microservices Debugging where a request might traverse multiple services. You need to know that “Error in processing” in Service B correlates to “User clicked button” in Service A.
The Role of Interactive Debuggers
While I emphasize tracing for expressions, I don’t ignore interactive tools. I use the Werkzeug debugger (built into Flask) extensively for catching unhandled exceptions. It allows you to execute code in the browser at the point of failure. However, for API Development where you are consuming JSON, the browser debugger isn’t always accessible.
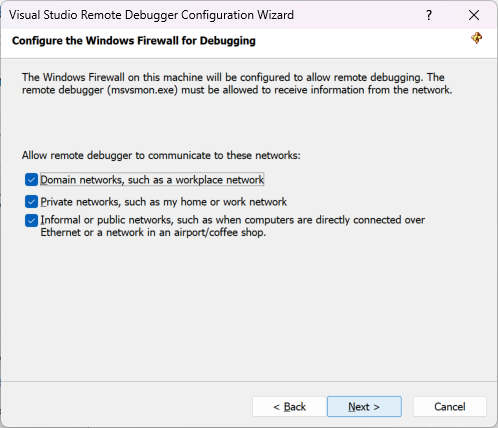
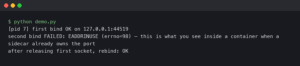
In these cases, I rely on remote debugging configurations. I configure my Docker containers to expose the debug port so I can attach my IDE (VS Code or PyCharm) directly to the running container. This is far superior to local-only debugging because it mimics the production environment (Linux paths, permissions, environment variables).
If you are doing Docker Debugging, make sure your CMD in the Dockerfile allows for the debugger to attach. I often have a docker-compose.debug.yml override file that changes the entry point to start the app with a debugger wrapper like debugpy.
When to Stop Tracing

There is a risk with these techniques: log noise. If you leave expression tracers active in a high-traffic loop, you will flood your logs and degrade performance. This is why I treat these tracers as surgical tools, not permanent fixtures.
My workflow is:
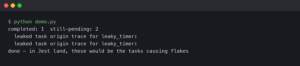
- Identify the “black box” (the template or expression failing silently).
- Inject the tracer (the Jinja filter or the Python wrapper).
- Reproduce the issue and analyze the trace.
- Fix the bug.
- Remove the tracer.
I never commit code with | debug_trace inside a template. It’s a development artifact. For long-term observability, I rely on proper Error Monitoring solutions like Sentry or structured logging that captures key events, not every intermediate variable.
Summary of Tools
To wrap this up, here is my toolkit for deep Flask debugging:
- Custom Jinja Filters: For peeking into template rendering logic.
- Expression Wrappers: For tracing values inside list comprehensions and lambdas.
- Request IDs: For correlating logs across async boundaries.
- Remote Debuggers: For attaching to Docker containers.
I used to think that if I couldn’t figure out a bug with a simple breakpoint, the code was too complex. Now I realize that the complexity of modern web apps—especially with the mix of declarative templates and functional Python patterns—requires a different set of eyes. We need to see the flow, not just the state.
Next time you are stuck on a Jinja template that refuses to render your data, don’t just stare at the code. Inject a tracer and watch the data flow. It changes everything.