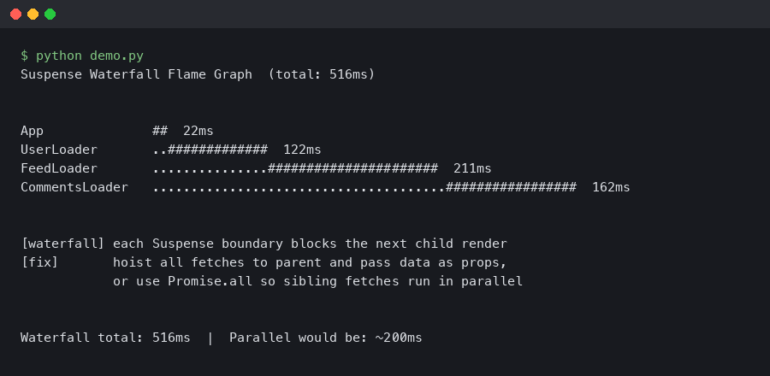


I was staring at a blank white screen at 11:30 PM last Tuesday. No errors in the console. The network tab showed a 200 OK. My local server was humming along happily. But the data? Gone. Just… empty.
My first instinct—and be honest, it’s yours too—was to sprinkle console.log('here'), console.log('here 2'), and console.log('wtf') throughout the component. I spent twenty minutes chasing a ghost, refreshing the browser like a rat pressing a lever for a pellet that wasn’t coming.
It turned out to be a race condition I would have caught in thirty seconds if I’d just used a breakpoint.
We need to talk about this. Because even in 2026, with browser tools that are frankly absurdly powerful, most of us still debug like we’re writing PHP in 2012. We guess. We change a variable, save, and pray. It’s exhausting, it’s inefficient, and it makes me want to throw my mechanical keyboard out the window.
The Console.log Trap
Look, I love console.log. It’s quick. It’s dirty. It’s comfortable. But it’s also a liar.
Here’s the thing about logging objects in modern browsers: they are live references. If you log an object, then mutate it three lines later, and then expand that object in the console, you might see the mutated version, not the version at the moment you logged it. I’ve lost hours to this.
If you absolutely must log (and I know you will), stop logging raw objects. JSON stringify them if you need a snapshot in time, or use console.table if you’re dealing with arrays of objects. It’s cleaner, and it makes you look like you have your life together.
const users = [
  { id: 1, name: 'Alice', role: 'admin' },
  { id: 2, name: 'Bob', role: 'user' },
  { id: 3, name: 'Charlie', role: 'user' }
];

// Stop doing this
console.log(users);

// Start doing this
console.table(users);
But seriously, try to wean yourself off the logs. The moment you find yourself writing a log to check the state of a variable, ask yourself: “Why am I not pausing execution here instead?”
Stop Time (It’s a Superpower)
The debugger; statement is underused. I put it directly in my code when things get weird. It forces the browser to freeze right there, assuming your DevTools are open. No hunting through file trees in the Sources tab trying to find the right line number.
Once you’re paused, the world is yours. You can hover over variables to see their current values. You can switch to the Console tab and execute code in the context of that specific scope.
Want to see what happens if response.data is null? Just type response.data = null in the console while paused, then hit “Resume.” You just simulated an edge case without changing your source code or mocking an API response. That’s speed.
Here is a pattern I use when I have a complex reduce function that’s spitting out garbage:
const total = items.reduce((acc, item) => {
  if (item.price === undefined) {
    // This stops execution ONLY when the bad data hits
    debugger;
  }
  return acc + item.price;
}, 0);
Instead of logging every iteration, I only pause when the specific condition that breaks my app occurs. Conditional breakpoints in the browser UI do the same thing, but I prefer writing it in code so I don’t forget where I put it. Just remember to remove it before you commit, or your CI/CD pipeline might yell at you (or worse, your users will get a paused browser).
The “Who Touched That?” Mystery
You know what’s fun? When a modal closes automatically and you have no idea why. Is it a click outside listener? A timer? A state change in a parent component? A redux action fired by a rogue useEffect?
I used to grep my codebase for setIsOpen(false) and add logs everywhere. It was miserable.
Then I started using DOM Breakpoints.
Right-click the element in the Elements panel. Select Break on > Attribute modifications. The second something changes that class or style or hidden attribute, the browser snaps into the debugger on the exact line of JS that caused the change.
It usually points to some library code you didn’t write, but if you look at the Call Stack (on the right side), you can trace it back to your code that triggered it. It feels like magic every time.
Network Lies and “It Works on My Machine”
Localhost is a lie. It’s a pristine, zero-latency utopia that doesn’t exist in the real world. Your users are on shaky 5G in a moving train, or bad coffee shop Wi-Fi.
I had a bug recently where a loading spinner wasn’t showing up. On my machine, the API was too fast—it returned in 15ms. React didn’t even have time to mount the spinner before the data arrived. But in production, users saw a blank screen for two seconds.
I didn’t need to write a delay function. I just went to the Network tab and changed “No throttling” to “Fast 3G.” Suddenly, my app felt sluggish, janky, and broken.
Perfect.
Now I could actually debug the loading states. If you aren’t throttling your network while developing, you aren’t seeing what your users see. You’re building for a best-case scenario that rarely happens.

The “Copy as cURL” Hammer
Frontend and Backend developers arguing about whose fault a bug is—name a more iconic duo.
“The API is returning 400 Bad Request,” I say.
“Works for me in Postman,” they say.
This conversation used to drag on for hours. Now, I end it in seconds. In the Network tab, right-click the failing request, select Copy > Copy as cURL.
Paste that into your terminal (or send it to the backend dev). It contains everything: the headers, the cookies, the exact payload, the user agent. If it fails there, it’s their problem. If it works there, it’s something weird in the browser context (CORS, maybe?). Either way, you stop guessing.
Scientific Method over Shotgun Debugging

The tools matter, but the mindset matters more. The biggest mistake I see—and I’m guilty of this when I’m tired or rushing—is “Shotgun Debugging.”
You see a bug. You have a vague idea. You change three things at once. You refresh. It works! Great. Which one fixed it? You don’t know. Or worse, it doesn’t work, and now you’ve introduced two new variables into the equation.
Slow. Down.
State a hypothesis. “I think the auth token is expiring before the request sends.”
Test only that. Verify the token expiration time. If that’s not it, revert any changes you made to test it, and move to the next hypothesis.
It feels slower because you aren’t frantically typing, but it’s actually faster because you aren’t running in circles. You are eliminating possibilities.
Debugging isn’t about fixing code. It’s about understanding why the code is doing what it’s doing. Once you understand the why, the fix is usually a one-liner. The hard part is resisting the urge to just smash keys until the red text goes away.