I value my file system. Maybe a little too much. But when I see people running these new autonomous coding agents directly on their host machines—giving an AI shell access to the same drive where they keep their tax returns and SSH keys—I get a physical reaction. It’s not a good one.
Call me paranoid. I don’t care. I keep my AI sandbox strictly separated from my daily driver. It runs in a remote VM, locked down, with no bridge back to my personal data. Safe? Yes. Convenient? Absolutely not.
The problem is visibility. When you lock an agent in a box, you can’t see what it’s doing. If it’s driving a browser to test a web app, and that browser is headless inside a container inside a VM, you are flying blind. The logs say “Clicked button,” but the test failed. Why? Did the modal cover the button? Did the CSS break? Who knows.
I spent three days last week trying to debug a phantom UI glitch that only happened in the sandbox. I tried screenshots. I tried video recording. It was like debugging via telegram. Eventually, I realized I was overcomplicating it. You don’t need fancy observability suites. You just need to forward the debug port.
The “Headless” Trap
Most of us run Chrome or Chromium in headless mode on servers. It saves resources. But Chrome has a built-in remote debugging protocol (CDP) that is surprisingly powerful. It listens on port 9222 by default.
If you were running locally, you’d just hit http://localhost:9222 and boom—you get a list of inspectable tabs. Click one, and you have the full DevTools UI inside another browser window. It’s magic.
But since I’m a coward who refuses to run this stuff locally, my browser is at 192.168.x.x or some cloud IP. And Chrome, by default, binds the debugger to 127.0.0.1. It doesn’t want you to talk to it from the outside. Which is good security, usually. Annoying for us right now.
The Fix: Port Forwarding (The Lazy Way)
You have two problems to solve here. First, you need to tell Chrome it’s okay to listen to strangers. Second, you need a tunnel.
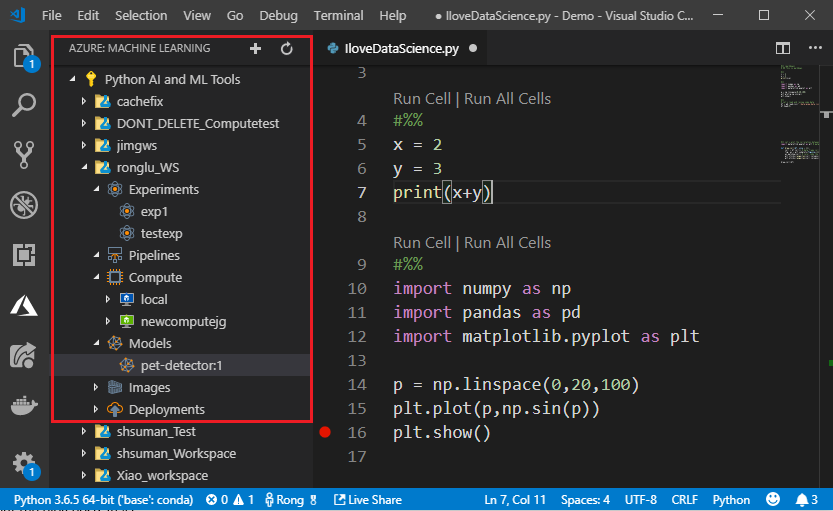
Launching Chrome in your sandbox needs specific flags. I messed this up about four times before reading the docs properly. You need to bind to 0.0.0.0 if you want it accessible from the VM’s network interface, not just the VM’s localhost.
# This is how you launch Chrome/Chromium to actually be debuggable
google-chrome \
  --headless=new \
  --remote-debugging-port=9222 \
  --remote-debugging-address=0.0.0.0 \
  --no-sandbox \
  --disable-gpu \
  https://example.com
Great. Now Chrome is listening. But if that VM is in the cloud or behind a firewall, you still can’t reach it. And honestly, opening port 9222 to the public internet is a resume-generating event. Do not do that. Anyone who connects to that port has full control over that browser instance.
Enter Socat (or SSH)
The cleanest way to bridge this gap without exposing yourself to the entire internet is SSH tunneling. It’s boring, reliable, and encrypted.
I run this on my local machine:
ssh -L 9222:localhost:9222 user@my-sandbox-vmNow, when I type localhost:9222 in my local browser, SSH ferries that traffic to the remote machine’s localhost:9222. Simple.
But wait. There’s a catch. Sometimes you aren’t just one hop away. Maybe your agent is inside a Docker container inside that VM. The VM can see the container, but localhost on the VM isn’t the container. It’s a mess of networking namespaces.
This is where socat saves my bacon. It’s the duct tape of networking. I use it to forward traffic from the VM’s loopback interface to the container’s IP.
If you are stuck in a scenario where simple SSH tunneling isn’t cutting it (like nested environments), run this on the intermediate machine:
# Forward local port 9222 to the target container's IP
socat TCP-LISTEN:9222,fork TCP:172.17.0.2:9222
I’ve used this exact command more times than I can count. It just grabs the packets and shoves them where they need to go. No complex iptables rules, no routing tables. Just “take this, put it there.”
The “chrome://inspect” Trick
Once the tunnel is up, don’t just go to localhost:9222 in your URL bar. You’ll get a raw JSON list of targets. It’s ugly and not very helpful unless you’re writing a scraper.
Instead, open a fresh tab in your local Chrome and type:
chrome://inspect/#devices
Ensure “Discover network targets” is checked and click “Configure”. Add localhost:9222 (or whatever port you forwarded). After a second, you should see the remote targets appear in the list. Click “inspect” and suddenly you have full DevTools—Elements, Console, Network, everything—running locally, but controlling the browser in the sandbox.
Why bother with all this friction?
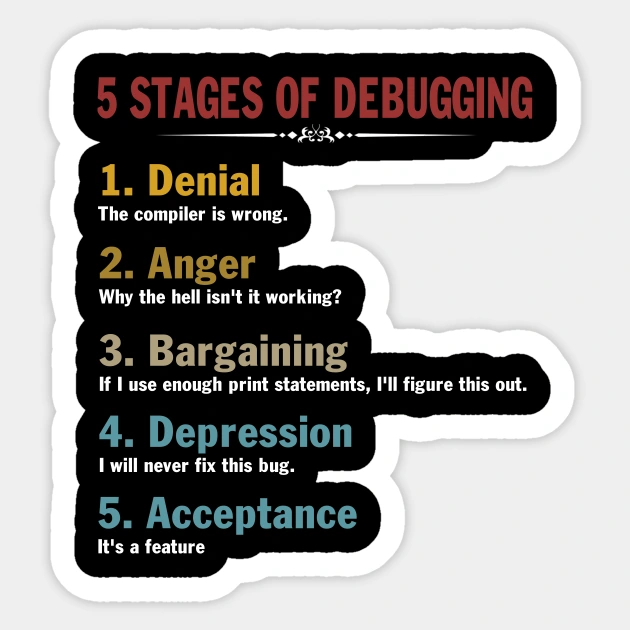
You might be thinking, “Just run the agent locally, you coward.”
No.
I’ve seen these agents hallucinate package imports. I’ve seen them try to edit system configuration files because they got confused about the current working directory. The isolation isn’t just for security; it’s for sanity. When the environment gets corrupted—and it will—I want to just docker restart or destroy the VM and start over. I don’t want to be restoring my laptop from a Time Machine backup on a Tuesday night.
This setup gives me the best of both worlds. The agent runs in a disposable, dangerous playground. I stay safe in my castle, looking through the telescope that is port forwarding.
One last tip: if the connection keeps dropping, check your socat timeout settings or the SSH ServerAliveInterval. Debuggers are chatty protocols; they don’t like high latency or dropped packets. If it feels laggy, that’s just physics telling you your VM is too far away. Deal with it.


