Actually, I should clarify – I spent three hours last Tuesday staring at a hex dump. Just staring. I was trying to figure out why my HTTP parser was chopping off the last byte of a payload, and the debugger was giving me absolutely nothing.
Well, not nothing. It gave me a memory address and a size. Thanks, I guess?
This is the state of C++ debugging in 2026. We have modules, we have coroutines, we have compile-time reflection around the corner, but if you want to see what’s inside a custom container in Visual Studio or VS Code, you’re often on your own. That is, unless the library author actually cares about you.
The “View” Problem
Here’s the thing. Modern C++ is all about views. We don’t copy data anymore; we point to it. std::span, std::string_view, and all the custom implementations floating around in various utility libraries. They are fantastic for performance. They are absolute garbage for debugging.
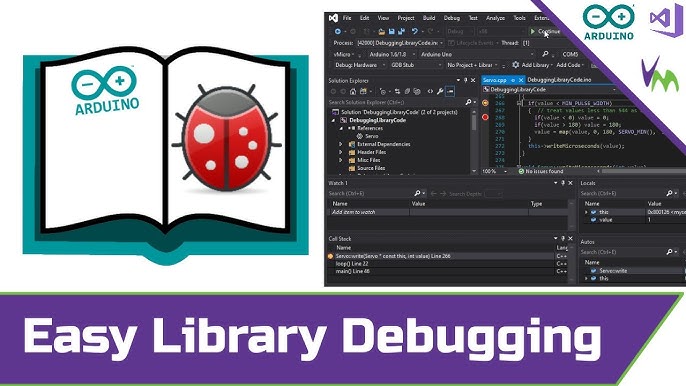
When you wrap a raw pointer and a length into a struct, the debugger’s default behavior is to show you… a pointer and a length. To see the data, you have to manually cast it in the Watch window, like (int*)mySpan.ptr, 10. It’s tedious. It breaks your flow. And if you’re iterating over a collection of spans? Forget it.
That’s why I was genuinely excited—like, fist-pump excited—when I saw the changelog for the Sane C++ Libraries back in December. Amidst the noise about allocation-free HTTP (which is cool, don’t get me wrong) and Async fixes, there was this little line item:
✅ Debug visualizers for Span<T>
It sounds small. It’s not.
XML is not a Programming Language
Let’s look at what this actually looks like. I threw together a quick test using the latest release (2025.12) just to verify I wasn’t hallucinating the improvement.
#include <SC/Utils/Span.h>
#include <vector>
#include <iostream>

struct Packet {
    int id;
    float value;
};

int main() {
    std::vector<Packet> rawData = {
        {1, 10.5f}, {2, 20.1f}, {3, 33.3f}, {4, 42.0f}
    };

    // Creating a slice (span) of the middle two elements
    SC::Span<Packet> view = SC::Span<Packet>(rawData.data() + 1, 2);

    // Breakpoint here
    return 0;
}
Before the update, inspecting view gave me:
view
  > data: 0x0000012345678
  > size: 2
With the new visualizers included in the library? I get this automatically:
view
  > [0] { id=2, value=20.1f }
  > [1] { id=3, value=33.3f }
  > size: 2
The “Allocation Free” Trap
I want to touch on the other part of that update briefly—the HTTP library going allocation-free. This ties into debugging more than you think.
Here is my benchmark:
On the previous version, handling 10k requests/sec spiked my memory usage graph like a heart monitor. With the December update? Flatline. It just reuses the buffer. But here’s the catch—debugging reused buffers is usually a nightmare because old data lingers.
This is where the visualizers come back in. Because the Span visualizer respects the current size of the slice, I don’t see the stale garbage data sitting at the end of the buffer from the previous request. I only see the active payload. That distinction is the difference between “I fixed this in 5 minutes” and “I need more coffee.”
Why Don’t More Libraries Do This?
Honestly? Because it’s boring work. Writing a killer async engine is fun. Writing XML configurations for VS Code (lldb-dap) or Visual Studio is chores. It’s taking out the trash.
But when you’re choosing a library dependency in 2026, you shouldn’t just look at benchmarks. You should look at the developer experience. If I pull in a library and I can’t inspect its core types without casting pointers, I’m probably going to replace it within six months. Just like if I pull in a library that doesn’t have good logging and debugging support.
A Warning on Compatibility
One gotcha I ran into: if you are using a heavily customized LLDB setup (like I do on my MacBook M3), sometimes the visualizers don’t auto-load if your .lldbinit is messing with the source maps. I had to manually source the python script included in the library’s tools folder to get it working in VS Code 1.96.
Anyway, if you’re writing a library, please, for the love of all that is holy, include debug visualizers. Don’t make me look at hex dumps. I’m too old for that. Just like I’m too old for wasting time on kubectl debug.
FAQ
Why does Visual Studio show only a pointer and size when inspecting a std::span or string_view?
By default, debuggers treat view types as a raw pointer plus a length, because that’s literally what the struct contains. To see the underlying elements you have to manually cast in the Watch window, like (int*)mySpan.ptr, 10. Without custom debug visualizers supplied by the library author, inspecting spans is tedious and breaks your debugging flow, especially when iterating over collections of spans.
How do Sane C++ Libraries 2025.12 debug visualizers for Span work?
The 2025.12 release of Sane C++ Libraries adds debug visualizers for Span
Why is debugging allocation-free HTTP buffers in C++ easier with span visualizers?
Allocation-free HTTP libraries reuse the same buffer across requests, which normally leaves stale data from previous requests lingering at the end. Because the Span visualizer respects the slice’s current size, it only displays the active payload and hides the leftover garbage. That distinction turns a confusing session of inspecting old bytes into a five-minute fix rather than a coffee-fueled hunt.
Why aren’t my LLDB debug visualizers auto-loading in VS Code on a Mac?
A heavily customized LLDB setup can prevent visualizers from auto-loading, especially if your .lldbinit is modifying source maps. The author hit this on a MacBook M3 running VS Code 1.96 and had to manually source the Python script from the library’s tools folder to get the Sane C++ Span visualizer working. Check your .lldbinit source map configuration if visualizers silently fail to attach.