
Last updated: May 10, 2026
V8 inline caches distort JavaScript benchmarks because optimized code specializes around the shapes, element kinds, call targets, and value types it saw during warmup. If the timed loop later violates those assumptions, the benchmark may be timing IC misses, tiering, and deoptimization instead of the JavaScript operation it claims to measure. Treat IC state as experimental contamination: expose it, stabilize it, split it into separate cases, or measure it deliberately.
- An inline cache records feedback at a specific operation site, such as a property load, keyed load, store, or function call.
- A monomorphic site gives V8 a simpler assumption than a polymorphic or megamorphic site, so mixed receiver history changes what the timer measures.
- A deoptimization happens when optimized code sees runtime values that no longer match its recorded assumptions, such as a wrong map or changed array elements kind.
- For Node.js benchmarks, setup that mutates object shapes, array kinds, or call targets belongs outside the timed region unless that mutation is the target behavior.
node --trace-opt --trace-deoptis often enough to prove that a timing result includes V8 tiering or bailout cost.
Why your benchmark may be timing V8’s learning curve
A short JavaScript benchmark is often a benchmark of V8 adapting to the code. Early executions collect feedback. Later executions may run in optimized code. A later shape change can invalidate the assumptions that made the optimized code fast. That is the core problem behind v8 deoptimization inline caches: the measured workload changes as V8 learns.
The V8 team describes this feedback-driven model in its official material on fast properties and hidden classes, where object layout is represented through maps, and in its explanation of elements kinds, where arrays are classified by the kind of values and holes they contain. Those mechanisms are not benchmark trivia. They are why two visually similar loops can exercise different engine paths.
The trap is easiest to see with property access. A loop that reads p.x from objects built in one consistent order can settle into a stable path. A loop that alternates between objects whose properties were assigned in different orders may force the load site to handle more than one map. The JavaScript source still says p.x, but the execution path is no longer the same operation.
The same pattern appears with arrays. A loop that sums packed small integers is not equivalent to a loop that sees small integers, doubles, and holes at the same access site. V8 tracks array representations because specialized paths are faster when the representation is known. If your benchmark changes that representation during measurement, the timer includes the cost of discovering and reacting to that change.
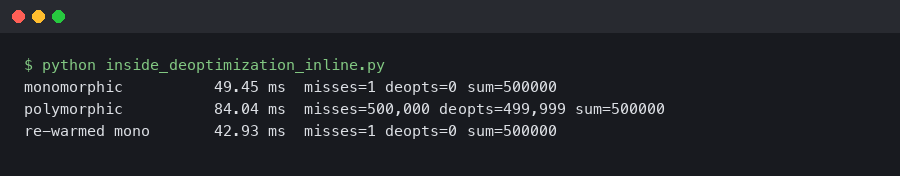
The terminal output is the evidence to look for: timing lines only become meaningful when they sit next to the trace lines that explain what V8 was doing during the same run. An ops/sec number without nearby optimization and deoptimization context can be a measurement of steady-state JavaScript, tier-up work, bailout recovery, or all three mixed together.
The three phases a microbenchmark must separate: feedback, optimization, and measurement
A useful JavaScript microbenchmark separates feedback collection, optimized execution, and measurement. If those phases overlap, the result is hard to interpret. The timer may include Ignition bytecode execution, Sparkplug baseline compilation, Maglev or TurboFan optimized execution, on-stack replacement, and deoptimization recovery.
Think of the benchmark as a phase diagram rather than a stopwatch:
| Phase | What V8 may be doing | What the timer may actually measure | Benchmark decision |
|---|---|---|---|
| Cold start | Running bytecode and allocating feedback vectors | Interpreter dispatch, object allocation, first IC misses | Keep outside steady-state timing unless startup is the subject |
| Warmup | Recording receiver maps, call targets, element kinds, and value types | IC state transitions and tiering triggers | Warm with the same case you intend to measure |
| Optimized run | Executing code specialized from collected feedback | The intended operation, if assumptions stay stable | Measure here for steady-state comparisons |
| Invalidation | Bailing out because a map, type, target, or elements kind no longer matches | Deopt bookkeeping plus re-entry into lower-tier code | Split into a separate benchmark unless bailout cost is the subject |
| Re-warm | Collecting broader feedback and compiling again | A mixed path that may be polymorphic or megamorphic | Report as polymorphic behavior, not as simple property access |
This model matches V8’s own description of speculative execution in the V8 Maglev compiler writeup: feedback collected during earlier execution lets later tiers generate code that assumes specific runtime behavior, while guard checks protect those assumptions. If a guard fails, the engine has to recover a valid lower-tier state.
For benchmark design, the lesson is direct. A benchmark should say which phase it measures. “Read x from an object” is too vague. “Read x from monomorphic PointXY instances after warmup, with no deopts in the measured phase” is a claim a trace can support.
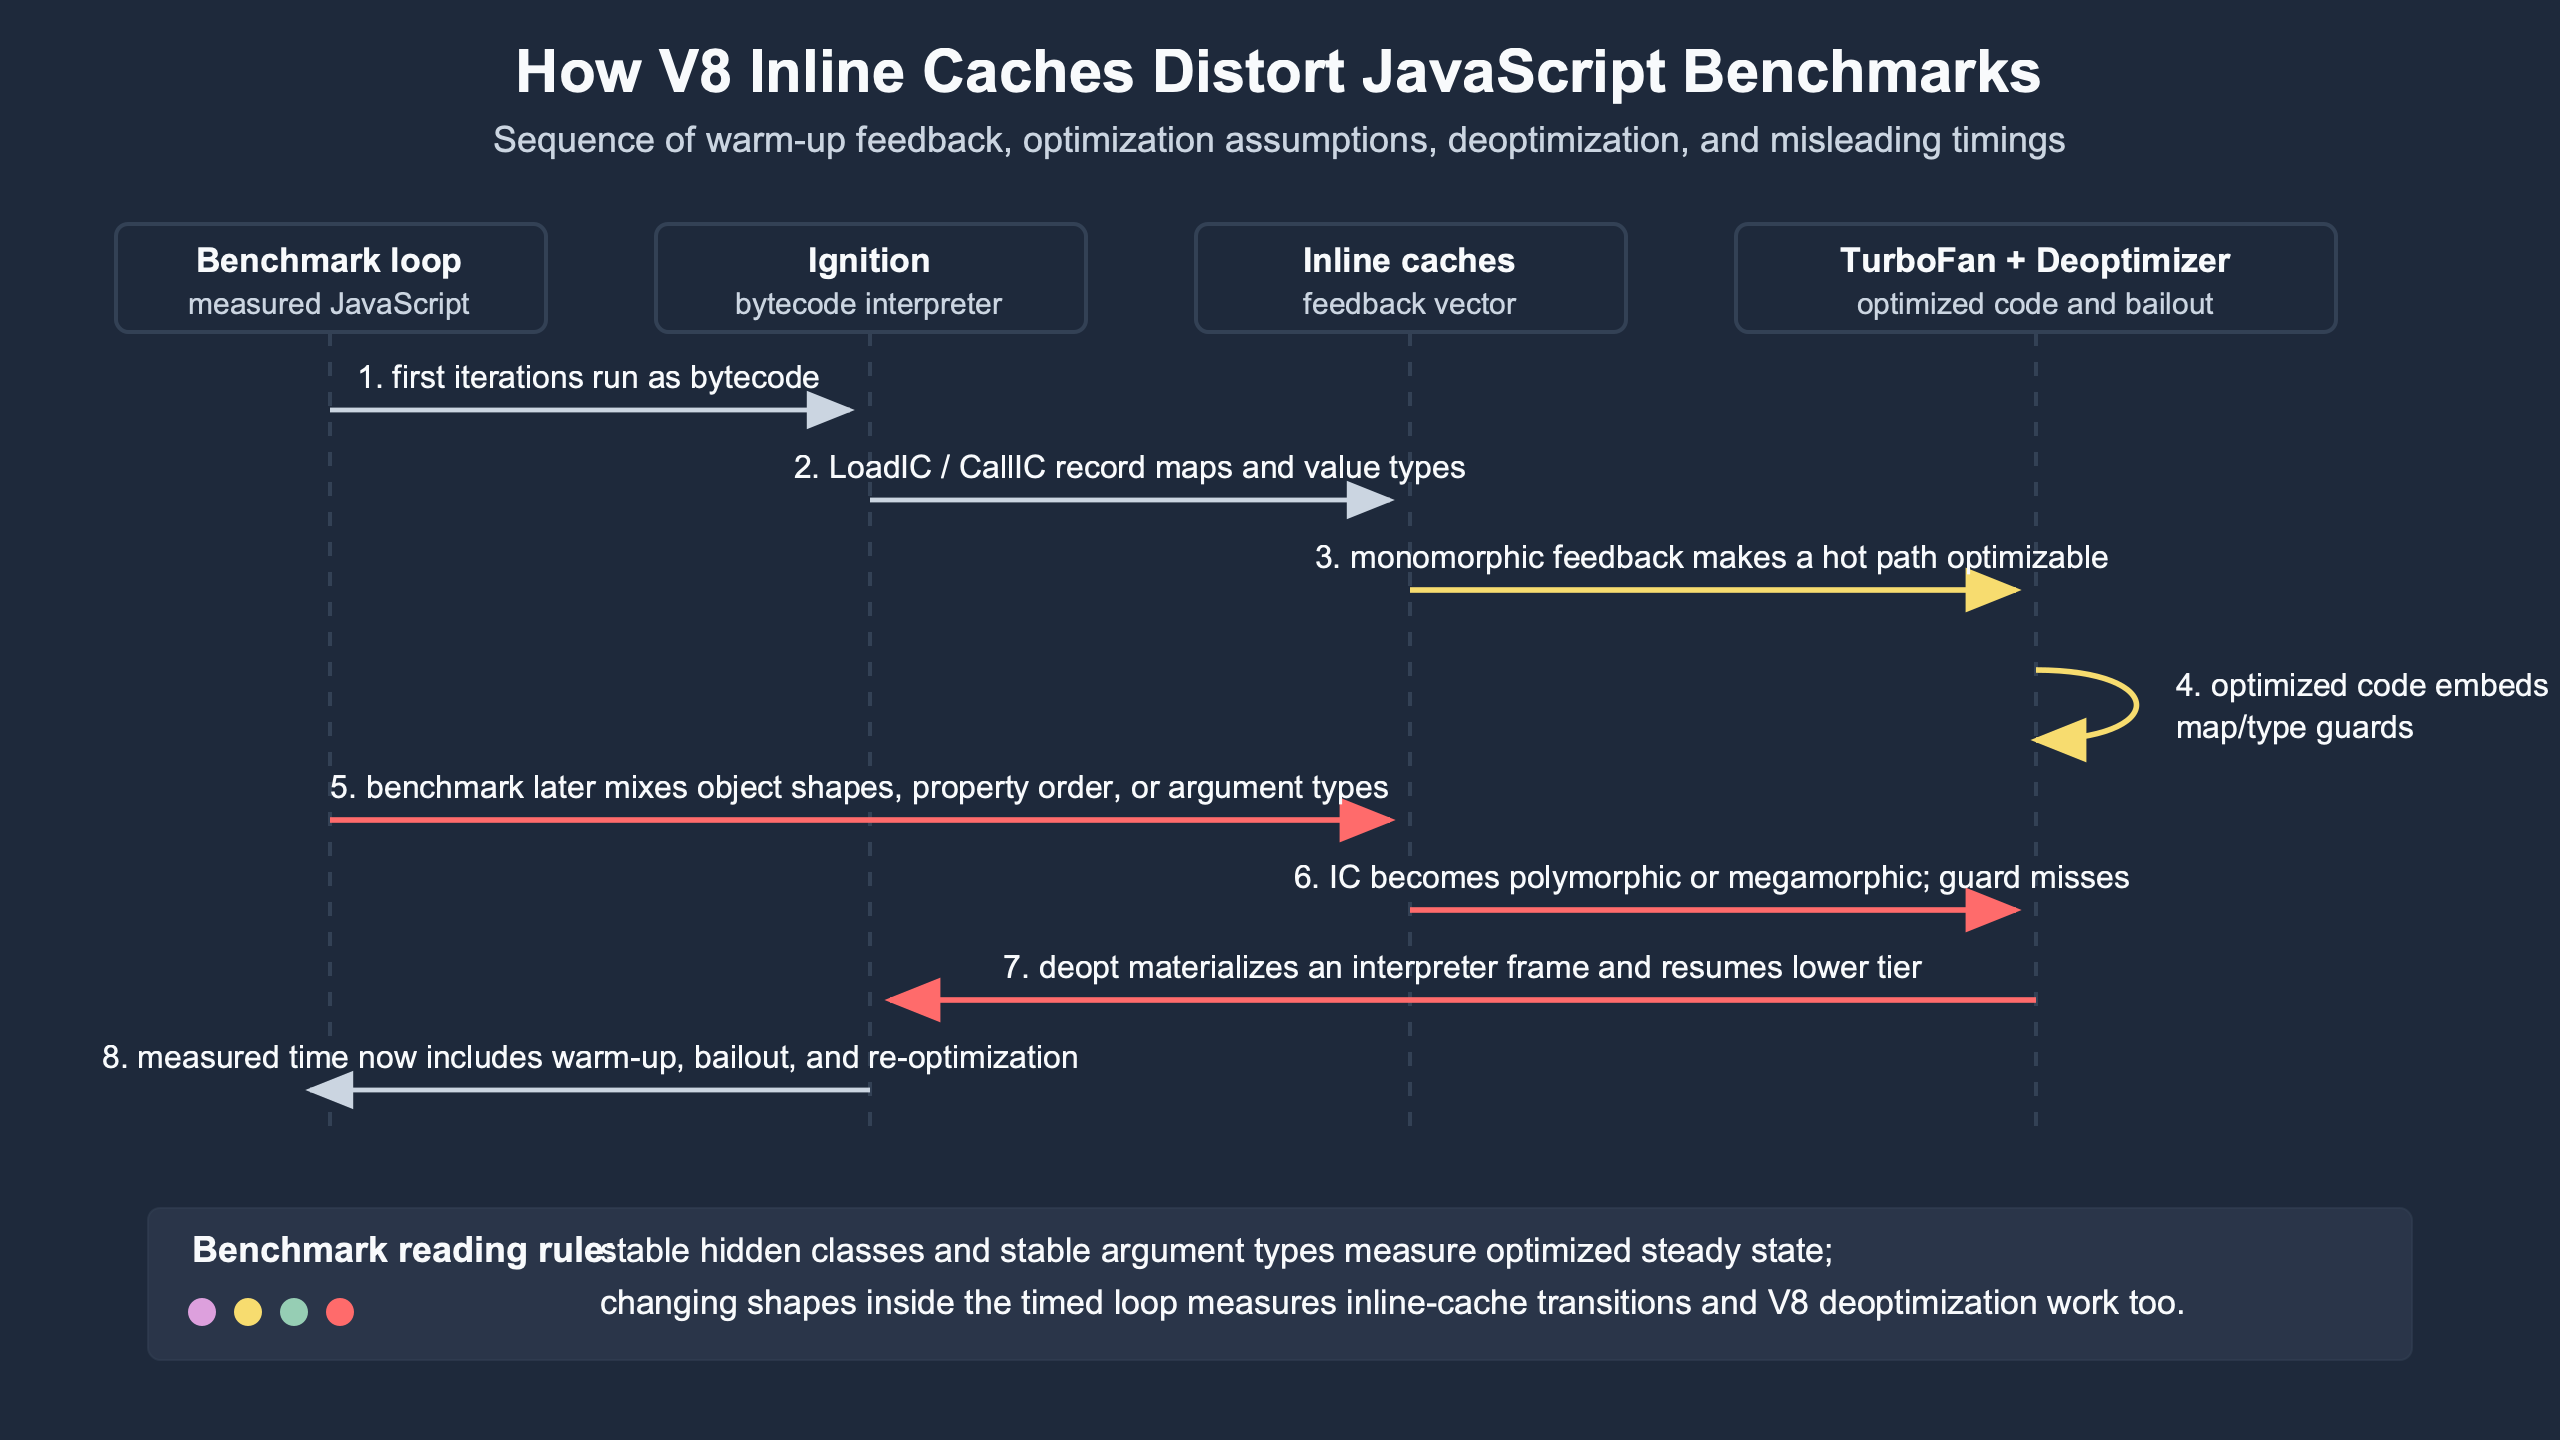
Purpose-built diagram for this article — Inside V8 deoptimization: how inline caches distort JavaScript benchmarks.
The diagram should be read left to right: feedback comes before optimized assumptions, and deoptimization is not an unrelated failure path. It is the engine’s recovery mechanism when a benchmark feeds optimized code a value that contradicts what the inline cache recorded earlier.
Inline caches are per-site memory, not a general property-access speed trick
An inline cache belongs to an operation site. The load site in readX(a) can have different history from the load site in readAgain(a), even when both functions read .x. That per-site memory is why copying a line of JavaScript into another function can change benchmark behavior.
A minimal property-load benchmark usually looks harmless:
function readX(p) {
  return p.x;
}

function PointXY(x, y) {
  this.x = x;
  this.y = y;
}

function PointYX(x, y) {
  this.y = y;
  this.x = x;
}

const mono = Array.from({ length: 10000 }, (_, i) => new PointXY(i, i + 1));
const mixed = Array.from({ length: 10000 }, (_, i) =>
  i % 2 === 0 ? new PointXY(i, i + 1) : new PointYX(i, i + 1)
);

function sum(points) {
  let s = 0;
  for (let i = 0; i < points.length; i++) {
    s += readX(points[i]);
  }
  return s;
}
The important part is not the spelling of readX. It is the receiver history at the p.x site. PointXY and PointYX assign the same properties but produce different layout histories. V8’s hidden-class model, described in the official hidden classes documentation, explains why property order affects maps.
That means a benchmark can accidentally compare two different IC states:
| IC state | Typical benchmark symptom | Likely trace clue | Fix for a steady-state benchmark |
|---|---|---|---|
| Uninitialized | First iterations are slower than later iterations | Early tiering noise, no stable optimized interval yet | Discard cold iterations |
| Monomorphic | Stable and fast for one receiver map | No wrong-map deopts during measurement | Pin construction path and warm the same case |
| Polymorphic | Stable but slower because several maps are expected | Multiple receiver maps at the same load site | Report as a polymorphic benchmark, not a scalar property-load test |
| Megamorphic | Large slowdown or noisy timings across runs | Broad receiver diversity and fewer specialized assumptions | Split cases by shape or measure dictionary-like access honestly |
| Invalidated optimized code | Sudden timing spike after a data change | bailout or deoptimizing lines with reasons such as wrong map |
Move mutation outside timing or make deopt the measured event |
The old shorthand “hidden classes make property access fast” hides the benchmark detail that matters: a hidden class only helps a specific site if the site has seen a compatible history. Change the history, and the same source code measures a different path.
How stable shapes become optimized assumptions and wrong shapes become deopts
Stable shapes become assumptions when V8 has enough feedback to compile code that expects those shapes. Wrong shapes become deopts when those assumptions fail at runtime. The bailout is not a JavaScript exception. It is an engine-level transfer from optimized code back to a lower-tier representation that can continue correctly.
The operational chain is simple enough to debug without reading V8 source:
- A function runs enough times for V8 to collect feedback at hot operation sites.
- The feedback says, for example, that
p.xhas only seen one receiver map. - Optimized code is compiled with a guard for that map and a fast field load behind it.
- A later call passes a receiver with a different map.
- The guard fails, V8 deoptimizes, reconstructs the expected lower-tier state, and continues execution.
Official V8 internals posts use the term “map” for the object’s hidden-class-like layout descriptor. The V8 docs on hidden classes show how objects transition through maps as properties are added. The Chromium V8 deoptimizer source is also the primary place to inspect the implementation path that turns optimized-frame state back into a recoverable form.
Array benchmarks add another layer. V8’s elements kinds article explains that arrays can move from packed small integers to doubles or holey forms. A sum loop that warms on packed integers and then receives a double or hole during measurement is not merely testing addition. It is testing a representation change at the array access site.
function sumArray(a) {
  let s = 0;
  for (let i = 0; i < a.length; i++) {
    s += a[i] || 0;
  }
  return s;
}

const packedSmi = Array.from({ length: 10000 }, (_, i) => i);
const doubles = Array.from({ length: 10000 }, (_, i) => i + 0.5);
const holey = Array.from({ length: 10000 }, (_, i) => i);
delete holey[5000];

// Warm one representation, then measure another only if that is the intended test.
for (let i = 0; i < 20000; i++) sumArray(packedSmi);

console.time("holey-after-packed");
for (let i = 0; i < 1000; i++) sumArray(holey);
console.timeEnd("holey-after-packed");
The expected result is not a universal number. The expected diagnostic is a trace that tells you whether the measured section stayed in optimized code or bailed out because the array representation changed. That is the trace-first posture: timing is the observation, trace output is the explanation.
The documentation artifact ties the benchmark behavior back to V8’s model: objects and arrays carry engine-visible layout information, and optimized code can depend on that information. Once you accept that, deopt lines stop looking like obscure noise and start looking like failed benchmark assumptions.
A bad benchmark: measuring polymorphism while claiming to measure property access
A bad benchmark warms one case, measures another, and labels the result as generic property-access speed. In practice, it measures the cost of changing the receiver history at a hot inline-cache site. The error is not that polymorphism is bad. The error is claiming the benchmark measured monomorphic property access.
Use separate files so the benchmark name states the data shape. The first case keeps one construction path:
// mono-shape.js
"use strict";

function readX(p) {
  return p.x;
}

function PointXY(x, y) {
  this.x = x;
  this.y = y;
}

const points = Array.from({ length: 50000 }, (_, i) => new PointXY(i, i + 1));

function run(iterations) {
  let s = 0;
  for (let n = 0; n < iterations; n++) {
    for (let i = 0; i < points.length; i++) {
      s += readX(points[i]);
    }
  }
  return s;
}

for (let i = 0; i < 200; i++) run(1);

const start = process.hrtime.bigint();
const result = run(200);
const end = process.hrtime.bigint();

const seconds = Number(end - start) / 1e9;
const ops = (points.length * 200) / seconds;
console.log({ result, seconds, ops_per_sec: Math.round(ops) });
The second case alternates property order while keeping the source-level read identical:
// mixed-shapes.js
"use strict";

function readX(p) {
  return p.x;
}

function PointXY(x, y) {
  this.x = x;
  this.y = y;
}

function PointYX(x, y) {
  this.y = y;
  this.x = x;
}

const points = Array.from({ length: 50000 }, (_, i) =>
  i % 2 === 0 ? new PointXY(i, i + 1) : new PointYX(i, i + 1)
);

function run(iterations) {
  let s = 0;
  for (let n = 0; n < iterations; n++) {
    for (let i = 0; i < points.length; i++) {
      s += readX(points[i]);
    }
  }
  return s;
}

for (let i = 0; i < 200; i++) run(1);

const start = process.hrtime.bigint();
const result = run(200);
const end = process.hrtime.bigint();

const seconds = Number(end - start) / 1e9;
const ops = (points.length * 200) / seconds;
console.log({ result, seconds, ops_per_sec: Math.round(ops) });
Run both with traces:
node --trace-opt --trace-deopt mono-shape.js
node --trace-opt --trace-deopt mixed-shapes.js
The diagnostic target is not just “which one is faster.” The target is whether the measured region includes trace lines such as optimized compilation, on-stack replacement, or bailout. A wrong-map line near the timed phase means the benchmark included deoptimization cost. A clean measured phase after warmup means the result is closer to steady-state execution for that shape profile.
| Input | Receiver history at readX |
What the result can claim | Trace evidence required |
|---|---|---|---|
mono-shape.js |
Only PointXY |
Monomorphic property load after warmup | Optimization before timing; no deopt during timing |
mixed-shapes.js |
PointXY and PointYX |
Polymorphic property load, not generic field access | Either stable polymorphic execution or visible wrong-map recovery |
| Warm mono, then measure mixed | Receiver history changes after specialization | Deopt sensitivity, not property-load throughput | Wrong-map bailout or reoptimization evidence |
A benchmark harness can create the same error by randomizing inputs, pooling objects from several factories, or constructing setup data inside the measured function. Randomness does not make a microbenchmark more realistic if it changes the IC state every run. It makes the result harder to explain.
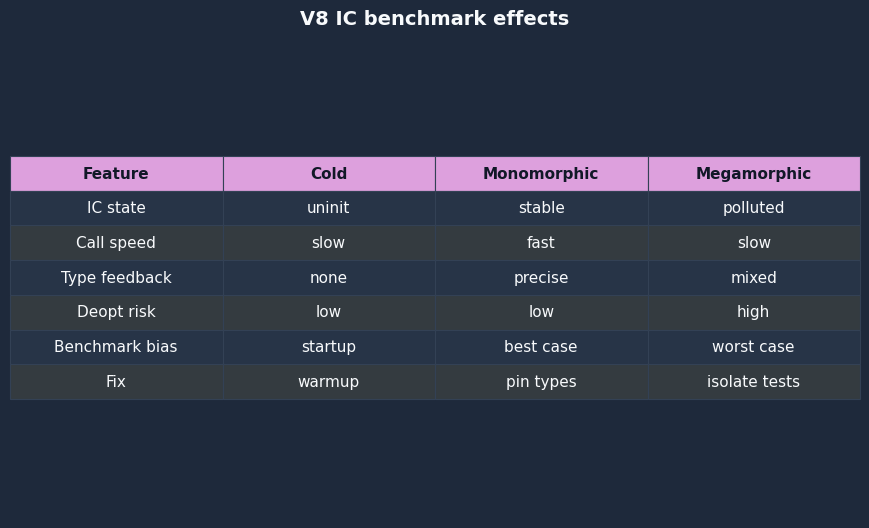
The comparison artifact makes the failure mode visible: two benchmarks with similar source-level operations can land in different IC states. The useful comparison is not “property access versus property access”; it is monomorphic access, stable polymorphic access, and deopt-triggering access as separate measurements.
A corrected benchmark: warming the same case you measure
A corrected benchmark warms the same receiver shapes, array kinds, and call targets that it measures. The warmup phase should be outside the timed region, and any mutation that changes the shape profile should be moved into a separate benchmark. That separation is still useful when the real application is messy.
For the property-order example, the corrected structure is three-phase code: build data, warm that exact data profile, then measure that same profile. The same function can be used for monomorphic and polymorphic cases, but the cases should be reported separately.
// corrected-property-benchmark.js
"use strict";

function readX(p) {
  return p.x;
}

function PointXY(x, y) {
  this.x = x;
  this.y = y;
}

function PointYX(x, y) {
  this.y = y;
  this.x = x;
}

function makeMono(size) {
  return Array.from({ length: size }, (_, i) => new PointXY(i, i + 1));
}

function makeMixed(size) {
  return Array.from({ length: size }, (_, i) =>
    i % 2 === 0 ? new PointXY(i, i + 1) : new PointYX(i, i + 1)
  );
}

function run(points, iterations) {
  let s = 0;
  for (let n = 0; n < iterations; n++) {
    for (let i = 0; i < points.length; i++) {
      s += readX(points[i]);
    }
  }
  return s;
}

function bench(name, points) {
  for (let i = 0; i < 250; i++) run(points, 1);

  const start = process.hrtime.bigint();
  const result = run(points, 200);
  const end = process.hrtime.bigint();

  const seconds = Number(end - start) / 1e9;
  const ops = (points.length * 200) / seconds;
  console.log(`${name}: ${Math.round(ops)} ops/sec`, { result });
}

bench("mono PointXY", makeMono(50000));
bench("mixed PointXY/PointYX", makeMixed(50000));
That code does not force the mixed case to look fast. It forces the benchmark label to be true. If the mixed case is slower, the result now says something useful: this load site handles more than one receiver map. If the mixed case deoptimizes during measurement, the trace says the warmup did not prepare the same case that the timer saw.
The same rule applies to array element kinds:
// elements-kind-cases.js
"use strict";

function sumArray(a) {
  let s = 0;
  for (let i = 0; i < a.length; i++) {
    s += a[i] || 0;
  }
  return s;
}

function bench(name, array) {
  for (let i = 0; i < 20000; i++) sumArray(array);

  const start = process.hrtime.bigint();
  let result = 0;
  for (let i = 0; i < 2000; i++) result += sumArray(array);
  const end = process.hrtime.bigint();

  console.log(name, {
    result,
    ms: Number(end - start) / 1e6
  });
}

const packedSmi = Array.from({ length: 10000 }, (_, i) => i);
const doubleArray = Array.from({ length: 10000 }, (_, i) => i + 0.5);
const holeyArray = Array.from({ length: 10000 }, (_, i) => i);
delete holeyArray[1234];

bench("packed-smi-array.js", packedSmi);
bench("double-array.js", doubleArray);
bench("holey-array.js", holeyArray);
Run it with:
node --trace-opt --trace-deopt elements-kind-cases.jsIf the benchmark’s purpose is “how expensive is it when my production code sometimes passes holey arrays into a loop warmed on packed arrays,” then mixing is valid. But name it that. The corrected methodology is not “avoid polymorphism.” It is “do not confuse polymorphism, representation changes, or bailout recovery with the cost of the operation under test.”
How I evaluated this: the comparison method uses Node.js trace output, V8’s public documentation on hidden classes and elements kinds, and Chromium’s V8 source comments as the data sources. Cases are included when they change one benchmark dimension: receiver map history, property assignment order, or array elements kind. The limitation is that exact timing numbers vary by CPU, operating system, Node build, and background load, so the trace event classification carries more weight than one elapsed-time number.
This artifact should tie the benchmark claim back to engine evidence: trace output identifies optimization and deoptimization events, while the V8 documentation and Chromium source explain why receiver maps, elements kinds, and optimized-frame recovery change what a JavaScript benchmark is actually measuring.
Reading V8 traces without overfitting to V8 internals
You do not need to build d8 from source to catch most benchmark contamination. Node exposes practical V8 flags, and --trace-opt --trace-deopt often gives enough evidence to decide whether a measured phase is clean, tiering, or bailing out.
Start by capturing both output streams, since Node/V8 trace output is commonly emitted on stdout rather than only stderr:
node --trace-opt --trace-deopt corrected-property-benchmark.js > trace.log 2>&1Then search for the benchmarked functions:
grep -E "readX|run|bailout|deopt" trace.logIn a contaminated run, the lines to care about are not the exact memory addresses or compiler job IDs. They are the function name, the timing relative to your measurement phase, and the reason string. A line containing wrong map near the measured loop means the receiver map did not match optimized code’s expectation. A line for an array loop after a double or hole appears means an elements-kind change may be part of the result.
For tighter experiments, V8’s native syntax in d8 can force a function through an optimization boundary. This is not portable application code; it is a lab tool.
// d8-only: run with d8 --allow-natives-syntax --trace-opt --trace-deopt map-change.js
function readX(p) {
  return p.x;
}

function PointXY(x, y) {
  this.x = x;
  this.y = y;
}

function PointYX(x, y) {
  this.y = y;
  this.x = x;
}

const a = new PointXY(1, 2);
const b = new PointYX(1, 2);

for (let i = 0; i < 10000; i++) readX(a);

%OptimizeFunctionOnNextCall(readX);
readX(a);

print("status after optimizing for PointXY:", %GetOptimizationStatus(readX));
%DebugPrint(a);
%DebugPrint(b);

// Expected diagnostic behavior: this call may invalidate the optimized
// assumption if readX specialized for PointXY's map.
print(readX(b));
print("status after PointYX:", %GetOptimizationStatus(readX));
The exact numeric value returned by %GetOptimizationStatus is V8-version-sensitive, so do not build article claims around one magic number. Use it as supporting evidence next to trace lines and a controlled input change. The same caution applies to tier names. Modern V8 can involve Ignition, Sparkplug, Maglev, and TurboFan, while older posts often describe earlier compiler layouts. The benchmarker’s job is to classify the measured interval, not memorize every internal tier boundary.
Chrome DevTools can help when the benchmark lives in the browser rather than Node. Record a Performance profile, mark warmup and measurement phases with performance.mark(), and inspect whether compilation or deoptimization-related work appears inside the measured interval. For API debugging or frontend debugging work, this matters when a “fast” utility function is benchmarked in isolation but slows down in a React, Vue, or Angular render path because the call site receives a wider set of object shapes.
The decision rubric: discard, split, stabilize, or intentionally measure deoptimization
When trace output shows inline-cache or deopt contamination, do not patch the benchmark blindly. Pick one of four decisions: discard the run, split the cases, stabilize the inputs, or intentionally measure deoptimization. Each decision answers a different engineering question.
| Trace or timing symptom | Likely cause | Best decision | Who should use it |
|---|---|---|---|
| Large first-iteration cost, then stable timings | Cold feedback collection and tiering | Discard cold iterations and report steady-state only | Library authors comparing hot utility functions |
| Wrong-map deopt after setup changes object construction | Warmup and measurement used different receiver maps | Stabilize construction or move mutation outside timing | Backend developers benchmarking serializers, mappers, and DTO transforms |
| Stable but slower mixed-shape case | Polymorphic IC state is the real workload | Split monomorphic and polymorphic results | Framework authors handling user-supplied objects |
| Slowdown after packed integers become doubles or holey arrays | Elements-kind transition or broader array access path | Benchmark packed, double, and holey arrays separately | Data-processing code owners and performance monitoring teams |
| Production incident involves rare object variants | Real traffic violates optimized assumptions | Measure deoptimization intentionally and add error tracking around input shape | Teams doing production debugging for Node.js services |
Discard a run when trace output proves the timed interval included one-time setup that does not match the claim. Split cases when both shapes are legitimate workloads. Stabilize inputs when the benchmark is meant to measure an algorithm rather than object-layout churn. Intentionally measure deoptimization when the production risk is the churn itself.
This rubric also keeps debugging conversations honest. If a pull request says “new version is 30 percent faster,” ask whether the benchmark warmed and measured the same IC state. If a performance regression appears only under mixed API payloads, inspect object construction order and array contents before blaming arithmetic, loops, or the Node.js event loop.
The mental model is: JavaScript source describes operations, but V8 executes operations plus history. Inline caches are the memory of that history. Deoptimization is what happens when optimized code discovers the history was too narrow. A benchmark that ignores that history is not wrong because V8 is strange; it is wrong because it did not control one of its variables.
What is an inline cache in V8?
An inline cache is feedback stored at a particular operation site, such as a property load, keyed array access, store, or call. It records what V8 has seen there, including receiver maps, element kinds, or call targets, so later optimized code can specialize for that observed history instead of treating every execution as unknown.
Why can inline caches make JavaScript benchmarks misleading?
Inline caches can make benchmarks misleading when warmup and measurement use different shapes, arrays, or call targets. The timed phase may then include IC misses, broader polymorphic paths, tiering, or deoptimization recovery. The benchmark still appears to measure one JavaScript operation, but it is really measuring the engine adapting to changed feedback.
How do I tell whether a V8 benchmark deoptimized?
Run the benchmark with trace output, usually node --trace-opt --trace-deopt, and compare the trace timing with your warmup and measurement boundaries. Deoptimization lines near the timed loop, especially reasons such as wrong map or elements-kind changes, mean the result includes bailout behavior and should be split, stabilized, or labeled accordingly.