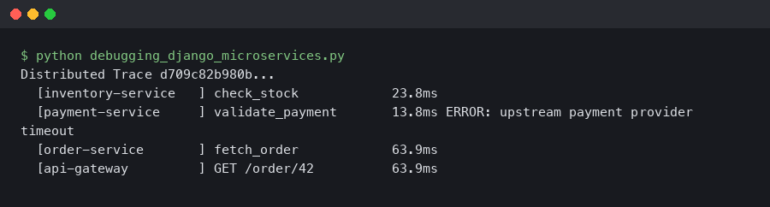
It was 3:00 AM on a Black Friday, and my phone was screaming. PagerDuty had just triggered a severity-one alert: our main API gateway was completely unresponsive. CPU utilization on our primary Node.js containers had flatlined at 100%, and the reverse proxy was actively dropping connections with a cascade of 502 Bad Gateway errors. Rolling back the deployment didn’t fix it. Scaling up the pods only delayed the inevitable by a few minutes. We were flying blind in the middle of our biggest traffic surge of the year.
If you build backend services with JavaScript long enough, you will inevitably face this exact nightmare. Because Node.js operates on a single-threaded event loop architecture, a single CPU-bound operation can block the entire process. When the thread is blocked, your application cannot accept new connections, process database callbacks, or respond to health checks. It effectively plays dead.
Figuring out exactly what is blocking that thread is one of the most frustrating Software Debugging experiences. But after spending years battling these performance bottlenecks in production environments, I’ve developed a battle-tested methodology. If you are frantically searching for how to debug nodejs high cpu usage, you’ve come to the right place. I am going to walk you through the exact tools, techniques, and code-level fixes I use to track down and eliminate CPU spikes in enterprise Node.js applications.
The Mechanics of Node.js CPU Exhaustion
Before we dive into Debugging Techniques, we need to understand the crime scene. Node.js uses the V8 JavaScript engine, which executes your code on a single main thread. It handles concurrency by offloading I/O operations (like database queries, network requests, and file system reads) to the underlying operating system via the libuv library. When those I/O operations finish, their callbacks are queued in the Event Loop to be executed by the main thread.
This architecture is incredibly efficient for I/O-heavy applications. However, it is an absolute disaster for CPU-heavy applications. If you write a synchronous piece of code that takes 500 milliseconds to execute—say, parsing a massive JSON payload or crunching a complex regular expression—the main thread is completely paralyzed for that half-second. No other requests can be handled. If ten users hit that endpoint simultaneously, your application is blocked for 5 seconds. CPU usage spikes to 100%, and your latency goes through the roof.
When investigating Node.js errors related to performance, you must first confirm that you are actually dealing with a CPU bottleneck and not an I/O bottleneck or a memory leak. Look at your Performance Monitoring dashboards (like Datadog, New Relic, or Grafana). If your CPU is pegged at 100% but your memory usage is relatively stable, you have a synchronous execution problem. If CPU and memory are both climbing aggressively, you might be dealing with Garbage Collection (GC) thrashing caused by a memory leak.
Step 1: Capturing the Problem with Profiling Tools
You cannot fix what you cannot see. When learning how to debug nodejs high cpu usage, your first instinct might be to litter your code with console.time() and console.timeEnd(), or to read JSON logs in your terminal. Stop right there. This is a production environment, and guessing will take you weeks. We need to use proper profiling tools to generate a CPU profile.
The Native V8 Profiler
Node.js has a built-in profiler that samples the call stack at regular intervals (usually every millisecond) to see exactly which functions are executing. If a function shows up in a large percentage of those samples, it’s a safe bet that it’s hogging the CPU.
If you can reproduce the issue locally, you can start your application with the --cpu-prof flag. As of Node.js 12+, this is the cleanest way to generate a profile.
node --cpu-prof app.js
Run your load testing tool (like autocannon or k6) against the application to trigger the high CPU usage. When you shut down the Node process (using Ctrl+C), it will write a .cpuprofile file to your disk.
Programmatic Profiling in Production
The --cpu-prof flag is great for local Code Debugging, but what if the issue only happens in production under real user traffic? You can’t just restart your production server with a profiling flag and wait for it to crash. Instead, you can use the built-in inspector module to generate a CPU profile programmatically on demand.
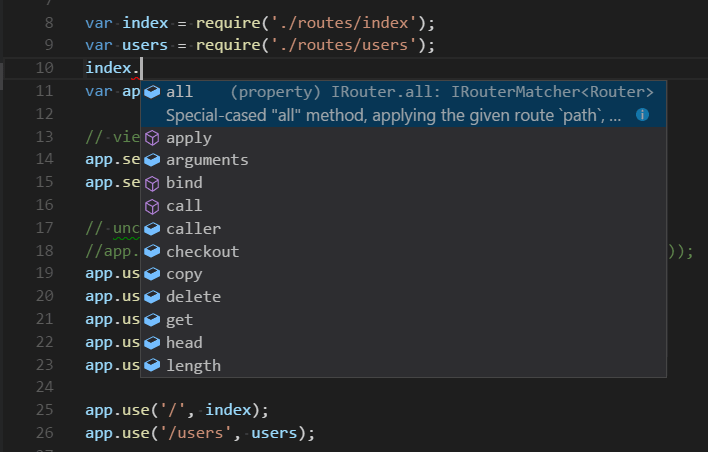
I always build a secure, hidden diagnostic endpoint into my Express APIs specifically for Production Debugging. Here is exactly how you do it:
const express = require('express');
const inspector = require('inspector');
const fs = require('fs');
const path = require('path');

const app = express();

// Secure this endpoint in production using middleware!
app.post('/debug/cpu-profile', (req, res) => {
  const session = new inspector.Session();
  session.connect();

  session.post('Profiler.enable', () => {
    session.post('Profiler.start', () => {
      console.log('CPU Profiling started...');

      // Let it profile for 10 seconds to capture the spike
      setTimeout(() => {
        session.post('Profiler.stop', (err, { profile }) => {
          if (!err) {
            const filename = path.join(__dirname, profile-${Date.now()}.cpuprofile);
            fs.writeFileSync(filename, JSON.stringify(profile));
            console.log(Profile saved to ${filename});
            res.status(200).send(Profile saved: ${filename});
          } else {
            res.status(500).send('Failed to generate profile');
          }

          session.post('Profiler.disable', () => {
            session.disconnect();
          });
        });
      }, 10000); // 10 seconds
    });
  });
});
When the CPU spikes, I trigger this endpoint. Ten seconds later, I have a perfect snapshot of exactly what the V8 engine was doing during the outage.
Step 2: Analyzing the Profile with Chrome DevTools
Now that you have a .cpuprofile file, you need to read it. Do not try to read the JSON directly. Instead, we are going to use Chrome DevTools, which is arguably the best Web Development Tool for JavaScript Debugging.
- Open Google Chrome.
- Open the Developer Tools (F12 or Cmd+Option+I).
- Click the three vertical dots in the top right of the DevTools panel, go to More tools, and select JavaScript Profiler.
- Click the Load button and select your
.cpuprofilefile.
Once loaded, change the view dropdown from “Heavy (Bottom Up)” to Chart. This generates a Flame Graph.
In a flame graph, the x-axis represents time, and the y-axis represents the call stack. You are looking for wide blocks. A wide block means a single function stayed on the call stack for a long time without yielding back to the event loop. If you see a function taking up 800ms of width on the chart, click on it. DevTools will tell you exactly which file and line number that function lives on. You have just found your bottleneck.
Step 3: Advanced Debugging with Clinic.js
If reading Chrome DevTools flame graphs feels too low-level, I highly recommend using Clinic.js. It is an open-source suite of Performance Monitoring and Node.js Development tools created by NearForm.
Clinic.js essentially automates the process of diagnosing performance issues. You install it globally:
npm install -g clinic
Then, you run your application wrapped in the Clinic Doctor tool:
clinic doctor -- node app.js
Hit your application with traffic. When you stop the process, Clinic.js generates a beautiful HTML report in your browser. It analyzes CPU usage, memory usage, and Event Loop Delay. If it detects a CPU bottleneck, the UI will explicitly tell you: “Your application has a potential CPU issue,” and it will recommend running clinic flame to generate a specialized, highly readable flame graph. It takes the guesswork entirely out of Backend Debugging.
Step 4: The Usual Suspects – Common CPU Bottlenecks
Over the years, I’ve found that when learning how to debug nodejs high cpu usage, developers often discover that the root cause falls into one of four distinct categories. Once you’ve identified the offending function in your flame graph, it’s likely doing one of these things.
1. Synchronous Cryptography (The Rookie Mistake)
This is the number one cause of CPU spikes in Node.js applications. A developer needs to hash a user’s password during registration or login, and they use the bcrypt library. Unfortunately, they reach for the synchronous version of the function.
const bcrypt = require('bcrypt');

// BAD: This blocks the entire event loop!
app.post('/login', (req, res) => {
  const password = req.body.password;
  // hashSync takes ~100ms to 300ms depending on rounds.
  // No other users can use the API during this time!
  const hash = bcrypt.hashSync(password, 12);
  // ...
});
The Fix: Always use the asynchronous versions of cryptography functions. These utilize libuv‘s internal thread pool to offload the heavy mathematical lifting away from the main Node.js thread.
// GOOD: Offloads work to the libuv thread pool
app.post('/login', async (req, res) => {
  const password = req.body.password;
  try {
    const hash = await bcrypt.hash(password, 12);
    // ...
  } catch (error) {
    // Error tracking logic here
  }
});
2. Regular Expression Denial of Service (ReDoS)
Regular expressions are powerful, but poorly written regexes can suffer from “catastrophic backtracking.” If you apply a complex regex to a sufficiently long input string, the regex engine can get stuck evaluating millions of permutations, locking up the CPU for seconds or even minutes.
For example, a regex meant to validate an email or a specific pattern like /^([a-zA-Z0-9]+\s?)*$/ might execute in 1ms on a valid string, but take 10 seconds on a carefully crafted invalid string like "aaaaaaaaaaaaaaaaaaaaaaaaaaaaaaaaaaaaaaaaaaaaaaaaaaaaa!".
The Fix: Audit your regexes. Use Static Analysis tools like eslint-plugin-regexp to catch inefficient patterns in your CI/CD pipeline. For critical production code, especially when processing user input, consider using the re2 library. re2 is a C++ regex engine bindings for Node.js that guarantees linear time execution, making ReDoS attacks mathematically impossible.
3. Massive JSON Parsing
JSON.parse() and JSON.stringify() are synchronous operations. If you are retrieving a 50MB JSON payload from a third-party API or your database and parsing it in memory, your main thread will block until the entire string is converted into a JavaScript object.
The Fix: Stop loading massive datasets into memory all at once. Use Streams (though be mindful of the Web Streams memory leak). If you are pulling large amounts of data from a database, stream the rows and process them one by one. If you must process a giant JSON file, use a streaming parser like stream-json.
const { chain } = require('stream-chain');
const { parser } = require('stream-json');
const { streamArray } = require('stream-json/streamers/StreamArray');
const fs = require('fs');

// Processes a massive JSON array without blocking the CPU
const pipeline = chain([
  fs.createReadStream('massive-data.json'),
  parser(),
  streamArray(),
  data => {
    // Process one object at a time
    console.log(data.value);
    return data;
  }
]);
4. Garbage Collection Thrashing
Sometimes, your flame graph will show a massive amount of time spent in functions named V8.GCScavenger or V8.GCMarkSweepCompact. This means your high CPU usage is actually a symptom of a memory leak. Your application is creating so many objects that the V8 Garbage Collector is running constantly, desperately trying to free up RAM. The CPU is maxed out just trying to take out the trash.
The Fix: You need to switch your focus from CPU profiling to Memory Debugging. Use the --inspect flag to take a Heap Snapshot in Chrome DevTools and look for objects that are failing to be garbage collected (often due to detached DOM nodes in Frontend Debugging or lingering closure scopes in Backend Debugging).
Step 5: Offloading Work with Worker Threads
Sometimes, you actually do need to perform heavy synchronous work. Maybe you are resizing images, generating complex PDF reports, or parsing massive CSV files. You can’t avoid the CPU cost, but you can move it off the main thread.
Since Node.js v10.5.0, we have native worker_threads. Workers allow you to spin up separate V8 isolates with their own memory and V8 engine instance. They run in parallel to the main thread.
However, manually managing the lifecycle of worker threads is tedious. For production applications, I highly recommend using a thread pool library like Piscina. Piscina handles task queuing, thread reuse, and error management automatically.
Here is an example of offloading a heavy mathematical operation using Piscina:
// main.js
const express = require('express');
const path = require('path');
const Piscina = require('piscina');

const app = express();

// Initialize the worker pool
const piscina = new Piscina({
  filename: path.resolve(__dirname, 'heavy-worker.js')
});

app.post('/generate-report', async (req, res) => {
  try {
    // Offload the CPU-intensive task to a worker thread
    const result = await piscina.run({ data: req.body });
    res.json({ success: true, report: result });
  } catch (err) {
    res.status(500).send('Report generation failed');
  }
});
// heavy-worker.js
module.exports = (workerData) => {
  // This code runs in a separate thread!
  // The main Node.js event loop remains completely unblocked.
  let result = 0;
  for (let i = 0; i < 1000000000; i++) {
    result += i * workerData.data.multiplier;
  }
  return result;
};
By moving this loop into heavy-worker.js, the Express server in main.js remains lightning fast and fully responsive to other users, completely solving the CPU bottleneck.
Implementing Event Loop Monitoring
You shouldn’t wait for your application to crash to know you have a CPU problem. Proactive Performance Monitoring is critical. The most important metric you can track in a Node.js application is Event Loop Lag (or Event Loop Delay).
Event loop lag measures the time it takes for a callback to execute after it has been queued. In a healthy Node.js application, this should be under 10-20 milliseconds. If it spikes to 500ms or 1000ms, it means the main thread is blocked.
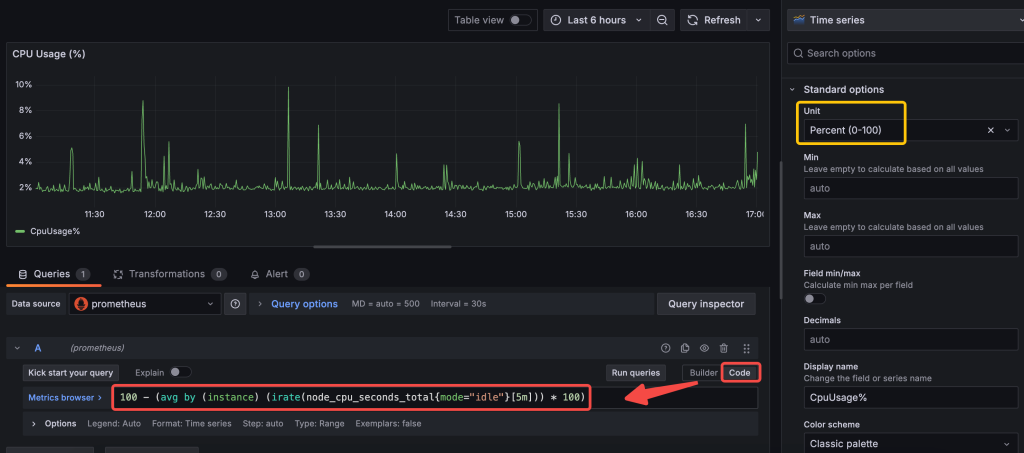
If you use Prometheus and Grafana for system monitoring, you can easily expose this metric using the prom-client library:
const client = require('prom-client');

// Automatically collects default metrics, including event loop lag!
const collectDefaultMetrics = client.collectDefaultMetrics;
collectDefaultMetrics({ timeout: 5000 });

app.get('/metrics', async (req, res) => {
  res.set('Content-Type', client.register.contentType);
  res.end(await client.register.metrics());
});
Set up an alert in your monitoring system: if Event Loop Lag exceeds 100ms for more than a minute, trigger a warning. This gives you time to investigate and utilize your Debug Tools before the server completely falls over.
FAQ: Common Node.js CPU Questions
What is a normal CPU usage for a Node.js application?
Normal CPU usage depends entirely on your workload and traffic, but generally, a healthy Node.js API should idle below 5% and average between 10% to 40% under moderate load. If your CPU usage is consistently hovering at 80-100% per core, or if it spikes and stays flatlined at 100%, you have an event loop blocking issue or a severe capacity problem.
How do I monitor the event loop lag in Node.js?
You can monitor event loop lag natively using the perf_hooks module, specifically the monitorEventLoopDelay function. For production environments, it is best to use APM tools like Datadog, New Relic, or the prom-client library to expose this metric to Prometheus, allowing you to set automated alerts when lag exceeds acceptable thresholds.
Will increasing RAM fix high CPU usage in Node.js?
No, throwing more RAM at a server will not fix high CPU usage unless the CPU spikes are specifically caused by Garbage Collection thrashing due to memory constraints. If your code relies on synchronous, CPU-bound operations (like heavy regex or synchronous crypto), increasing RAM will do absolutely nothing to unblock the V8 main thread.
Can memory leaks cause high CPU usage in Node.js?
Yes. When a Node.js application runs out of memory, the V8 Garbage Collector will aggressively attempt to free up space. This process (Mark-Sweep and Scavenge) is highly CPU-intensive. If the memory leak is severe, the application will enter a state of “GC thrashing,” where the CPU hits 100% purely from trying to run garbage collection before eventually crashing with an OOM (Out of Memory) error.
Conclusion
Learning how to debug nodejs high cpu usage is a rite of passage for every senior JavaScript developer. The key to surviving these incidents is to stop guessing and start measuring. Rely on profiling tools like Chrome DevTools, the native V8 profiler, and Clinic.js to generate flame graphs that pinpoint the exact function locking up your thread. Remember that Node.js is incredibly fast at I/O, but it will punish you severely for executing heavy synchronous code on the main thread.
Audit your code for the usual suspects: synchronous cryptography, dangerous regular expressions, and massive in-memory data processing. When you absolutely must perform heavy computations, offload them using Worker Threads and libraries like Piscina. Finally, instrument your applications with Event Loop Lag monitoring so you can catch performance regressions in your CI/CD pipeline or production environment long before they trigger a 3:00 AM PagerDuty alert.