In the world of software development, writing code is only half the battle. The other, often more challenging, half is finding and fixing the inevitable bugs that creep into our applications. Software debugging is the methodical process of identifying, analyzing, and removing these defects. It’s a critical skill that separates novice programmers from seasoned experts, transforming moments of frustration into opportunities for deeper understanding. While it can sometimes feel like searching for a needle in a digital haystack, a systematic approach, combined with the right tools and techniques, can make the process significantly more efficient and even rewarding.
This comprehensive guide will take you from the fundamental principles of debugging to advanced strategies used in modern development workflows. We’ll explore practical techniques, hands-on code examples in Python and JavaScript, and the best practices that empower developers to build more robust and reliable software. Whether you’re working on frontend web applications, backend services, or complex microservices architectures, mastering the art of debugging is essential for delivering high-quality products and accelerating your development cycle.
Understanding the Core Concepts of Software Debugging
Before diving into specific tools, it’s crucial to grasp the foundational principles that underpin all effective debugging. A solid conceptual understanding allows you to approach any bug, regardless of the language or platform, with a clear and logical strategy.
Adopt a Scientific Mindset
The most effective way to debug is to treat it like a scientific experiment. This involves a repeatable cycle:
- Observe and Reproduce: First, identify the bug and find a consistent way to reproduce it. An intermittent bug is the hardest to solve, so establishing a reliable trigger is paramount.
- Hypothesize: Based on the observed behavior and the error message, form a hypothesis about the root cause. What do you think is going wrong and why?
- Test: Design an experiment to test your hypothesis. This could involve adding log statements, changing a line of code, or using a debugger to inspect a variable’s state.
- Analyze and Repeat: Analyze the results of your test. Did they confirm or refute your hypothesis? Use this new information to refine your hypothesis and repeat the cycle until the root cause is found.
Reading Stack Traces and Error Messages
When a program crashes, it often leaves behind a crucial piece of evidence: the stack trace. A stack trace is a report of the active stack frames at a certain point in time during the execution of a program. It shows the path of function calls that led to the error. Learning to read them effectively is a non-negotiable debugging skill.
Consider this simple Python script designed to cause an error:
def calculate_ratio(total, count):
    """Calculates the ratio, but might fail."""
    ratio = total / count
    return ratio

def process_data(data):
    """Processes a dictionary of data."""
    total_items = data.get("total_items", 0)
    user_count = data.get("user_count", 0)

    # This will cause a ZeroDivisionError if user_count is 0
    result = calculate_ratio(total_items, user_count)
    print(f"The ratio is: {result}")

# Simulate receiving data with a zero count
incoming_data = {"total_items": 100, "user_count": 0}
process_data(incoming_data)
Running this code will produce the following stack trace:
Traceback (most recent call last):
  File "main.py", line 16, in <module>
    process_data(incoming_data)
  File "main.py", line 12, in process_data
    result = calculate_ratio(total_items, user_count)
  File "main.py", line 3, in calculate_ratio
    ratio = total / count
ZeroDivisionError: division by zero
To decipher this, read from the bottom up. The last line tells you the exact error: ZeroDivisionError: division by zero. The line above it (File "main.py", line 3, in calculate_ratio) pinpoints the exact line of code where the error occurred. Following the trace upwards shows you the sequence of calls that led to this point: process_data called calculate_ratio, which was initiated by the main script execution on line 16.
Hands-On Debugging: Tools and Practical Techniques
With the core concepts in mind, we can explore the tools that bring these principles to life. Modern development environments are rich with powerful debugging utilities that provide deep insights into your code’s execution.
Interactive Debuggers and Breakpoints
– Debugging code
– Software debugging
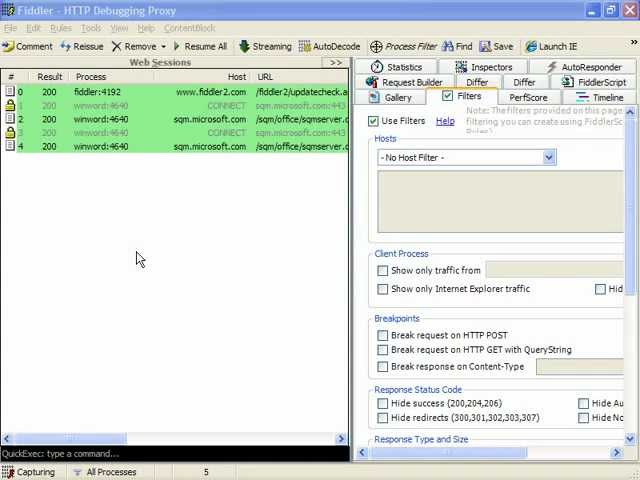
– Debugging process – Fiddler Web Debugging Proxy – Filtering by Process – Telerik
While logging is useful, an interactive debugger is far more powerful. It allows you to pause your program’s execution at specific points, called breakpoints, and inspect the state of your application in real-time. You can examine variable values, execute code line-by-line, and understand the program flow intimately.
Python’s built-in debugger is pdb. You can insert a breakpoint directly into your code:
import pdb

def complex_calculation(a, b, c):
    # Let's debug what's happening inside this function
    intermediate_result = (a * b) - c

    # Set a breakpoint here
    pdb.set_trace()

    final_result = intermediate_result ** 2
    return final_result

result = complex_calculation(10, 5, 20)
print(result)
When you run this script, execution will pause where pdb.set_trace() is called, and you’ll get an interactive prompt in your terminal. You can type commands like p intermediate_result (print variable), n (next line), or c (continue execution).
Frontend and Web Debugging with Browser DevTools
For frontend and web development, the browser’s built-in developer tools are indispensable. Google Chrome DevTools, for example, is a comprehensive suite for JavaScript debugging, network analysis, and performance profiling.
Key panels for debugging include:
- Console: Used for logging information with
console.log(),console.warn(), andconsole.error(). It also allows you to execute JavaScript expressions in the context of the current page. - Sources: This is where you can view your project’s source files (HTML, CSS, JS) and set breakpoints. Clicking on a line number in a JavaScript file will create a breakpoint, pausing execution when the browser reaches that line.
- Network: Crucial for API debugging, this panel shows all network requests made by the page. You can inspect request headers, payloads, and server responses to diagnose issues between the frontend and backend.
Here’s a simple JavaScript example for browser debugging:
function fetchUserData() {
    const userId = document.getElementById('userIdInput').value;
    console.log(`Fetching data for user ID: ${userId}`);

    // Set a breakpoint on the next line in Chrome DevTools' Sources panel
    fetch(`https://api.example.com/users/${userId}`)
        .then(response => response.json())
        .then(data => {
            console.table(data); // A great way to display object data
            displayUserData(data);
        })
        .catch(error => {
            console.error('Failed to fetch user data:', error);
        });
}

function displayUserData(user) {
    const container = document.getElementById('userDataContainer');
    container.innerHTML = `<h3>${user.name}</h3><p>Email: ${user.email}</p>`;
}
In this example, you can use the Console to see the log messages, the Network panel to inspect the fetch request, and the Sources panel to set a breakpoint and step through the code to inspect the userId variable or the data object received from the API.
Advanced Strategies for Complex Bugs
Some bugs are more elusive than others, especially in complex systems like microservices, asynchronous applications, or when dealing with performance issues. These scenarios call for more advanced debugging strategies.
Remote Debugging
Often, bugs only appear in a specific environment, such as a staging server or a Docker container. Remote debugging allows you to attach a debugger from your local machine to a process running on a remote system. This gives you the full power of an interactive debugger without having to replicate the entire production environment locally.
For example, you can launch a Node.js application with a special “inspect” flag:
node --inspect=0.0.0.0:9229 your_app.jsThen, using an IDE like VS Code, you can create a launch configuration to attach to that remote process. This enables you to set breakpoints and inspect variables on the server directly from your local development environment, which is invaluable for debugging issues in CI/CD pipelines or containerized applications.
Memory and Performance Debugging (Profiling)

– Debugging code
– Software debugging
– Debugging process – Monitoring HTTP Output with Fiddler in .NET HTTP Clients and WCF …
Not all bugs cause crashes. Some manifest as performance degradation, such as a slow UI, high CPU usage, or a memory leak where the application consumes more and more memory over time. This is where profiling tools come in.
Profilers analyze your application’s memory usage and execution time, helping you identify bottlenecks. Chrome DevTools has excellent Performance and Memory tabs for this purpose. The Memory tab can take heap snapshots, allowing you to compare memory usage before and after an action to find “detached” DOM nodes or other objects that are not being garbage collected.
A common source of memory leaks in JavaScript is an event listener that is never removed:
// Potential memory leak example
function setupComponent() {
    const element = document.getElementById('my-button');
    const largeDataObject = new Array(1000000).fill('*');

    function handleResize() {
        // This function holds a reference to largeDataObject
        console.log('Window resized!', largeDataObject.length);
    }

    window.addEventListener('resize', handleResize);

    // If we forget to remove the event listener when the component is destroyed,
    // 'handleResize' and 'largeDataObject' will never be garbage collected.
    // Correct way: return a cleanup function.
    // return () => window.removeEventListener('resize', handleResize);
}

setupComponent();
Debugging Asynchronous Code
Debugging asynchronous operations (Promises, async/await) can be tricky because the call stack is often cleared between asynchronous calls. This can make it hard to trace the origin of an error. Fortunately, modern debuggers and JavaScript engines have improved “async stack traces.” They reconstruct the logical call stack across asynchronous boundaries, making it much easier to see the chain of events that led to an error inside an async function.
Proactive Debugging: Best Practices and Modern Workflows
The best way to handle bugs is to prevent them or catch them early. Integrating debugging practices into your entire development lifecycle is key to building stable applications.
The First Line of Defense: Testing
Testing and Debugging are two sides of the same coin. A robust test suite (including unit, integration, and end-to-end tests) is your first line of defense. When a test fails, it immediately narrows down the problem to a specific component or interaction, making the bug much easier to find and fix. Writing tests forces you to think about edge cases and potential failure points before they become production issues.
Error Tracking and Monitoring in Production
No matter how much you test, some bugs will inevitably slip into production. Production Debugging relies on error tracking and monitoring tools like Sentry, Datadog, or New Relic. These services automatically capture unhandled exceptions in your live application, group them, and provide rich context like the user’s browser, OS, the request details, and the full stack trace. This allows you to discover, prioritize, and fix bugs affecting real users without having to rely on user reports.
Leverage Static Analysis Tools
Static Analysis tools, or linters (e.g., ESLint for JavaScript/TypeScript, Pylint for Python), analyze your code without executing it. They can catch a wide range of potential bugs, style violations, and “code smells” right in your editor. Configuring a strict linter is a simple, automated way to improve code quality and prevent common errors before they are even committed.
Conclusion
Software debugging is an essential, multifaceted skill that blends analytical thinking with technical proficiency. By moving beyond simple print statements and embracing a structured approach, you can significantly reduce the time spent hunting for bugs. Master the art of reading stack traces, become proficient with interactive debuggers like PDB and Chrome DevTools, and learn to use advanced tools for performance and memory profiling.
Furthermore, by integrating proactive strategies such as comprehensive testing, production error monitoring, and static analysis into your workflow, you can build a safety net that catches bugs early and often. Ultimately, effective debugging is not just about fixing what’s broken; it’s about deeply understanding your code and building more resilient, high-quality software from the ground up.