The Vicious Cycle of Manual Debugging and How to Break It
In modern software development, complexity is the new normal. We build distributed systems, manage microservices, and orchestrate complex data pipelines. While this architectural evolution enables incredible scale and resilience, it comes at a cost: debugging has become a monumental, time-consuming challenge. Developers spend countless hours sifting through terabytes of unstructured logs, trying to reproduce intermittent bugs in ephemeral environments, and manually correlating events across dozens of services. This reactive, manual approach to Bug Fixing isn’t just inefficient; it’s a direct drain on innovation and a primary cause of developer burnout.
Debug Automation offers a way out of this cycle. It represents a strategic shift from reactive problem-solving to proactive, system-driven diagnostics. It’s not about replacing human intuition but augmenting it with powerful tools and workflows that automatically detect, diagnose, and gather context around issues. By building systems that can investigate themselves, we free up engineering talent to focus on what they do best: building valuable features. This article explores the core principles, practical implementations, and advanced strategies you can use to build a robust debug automation pipeline, transforming your debugging process from a manual chore into an automated, intelligent, and scalable advantage.
Understanding the Core Principles of Debug Automation
Effective debug automation isn’t built on a single tool but on a foundation of solid principles. Before writing a single script, it’s crucial to understand the concepts that separate a noisy, unhelpful automation system from one that provides clear, actionable insights.
Beyond Logging: The Power of Structured, Actionable Data
The first step in automating any process is ensuring the input data is machine-readable and consistent. For decades, developers have relied on simple print statements and unstructured log lines (e.g., console.log("Processing user " + userId)). While useful for immediate, manual inspection in the Debug Console, this approach is a dead end for automation. Scripts cannot reliably parse free-form text to extract critical information.
The solution is structured logging. By formatting log entries as JSON or another key-value format, you create a data stream that can be easily queried, filtered, and processed by automated tools. Every log event becomes a rich data object containing not just a message, but also context like the service name, request ID, user ID, and a detailed Stack Trace. This structured data is the fuel for any effective Debug Automation engine.
import logging
import json
import traceback

class JsonFormatter(logging.Formatter):
    def format(self, record):
        log_record = {
            "timestamp": self.formatTime(record, self.datefmt),
            "level": record.levelname,
            "message": record.getMessage(),
            "module": record.name,
            "function": record.funcName,
            "line": record.lineno,
        }
        if record.exc_info:
            log_record['exception'] = "".join(traceback.format_exception(*record.exc_info))

        return json.dumps(log_record)

# --- Usage Example ---
handler = logging.StreamHandler()
handler.setFormatter(JsonFormatter())

logger = logging.getLogger('MyApiService')
logger.setLevel(logging.INFO)
logger.addHandler(handler)

def process_payment(user_id, amount):
    logger.info(f"Starting payment processing for user {user_id}")
    try:
        if amount <= 0:
            raise ValueError("Payment amount must be positive.")
        # ... payment logic here ...
        logger.info(f"Successfully processed payment for user {user_id}")
    except Exception as e:
        # The logger automatically captures and formats the exception
        logger.error(f"Failed to process payment for user {user_id}", exc_info=True)

process_payment("user-123", -50)
This Python Debugging example produces a clean JSON output that can be ingested by platforms like Elasticsearch or Datadog, allowing you to build automated alerts and dashboards based on specific error types or patterns.
The Critical Role of Determinism and Reproducibility
You can’t automate the debugging of a problem you can’t reliably reproduce. Determinism—the ability for a system to produce the same output given the same input—is a cornerstone of effective automation. In complex systems, sources of non-determinism are everywhere: network latency, random number generators, race conditions, and varying environment configurations.
To combat this, your automation strategy should prioritize creating reproducible environments. Containerization with tools like Docker is paramount. By packaging your application and its dependencies into a consistent image, you eliminate the “it works on my machine” problem. For CI/CD pipelines, this means running your automated tests and debug scripts inside the same Docker container that will be used in production, ensuring consistency across the entire Testing and Debugging lifecycle.

developer debugging code on screen – Programmer doing software debugging on isolated screen PC at …
Building Your Automated Debugging Toolkit
With a solid foundation of structured data and reproducible environments, you can begin building practical automation tools. The goal is to create a suite of scripts and processes that act as an early warning system, catching and diagnosing issues before they impact users.
Automated Health Checks and API Smoke Tests
The simplest yet most effective form of debug automation is the health check. These are lightweight scripts that run periodically or after a deployment to verify that critical components of your system are online and functioning correctly. For a microservices architecture, this could be a script that pings the /health endpoint of each service.
This Node.js Debugging example uses axios to perform a basic smoke test on a list of API endpoints, a common task in Microservices Debugging.
const axios = require('axios');

const services = [
  { name: 'Users Service', url: 'https://api.example.com/users/health' },
  { name: 'Orders Service', url: 'https://api.example.com/orders/health' },
  { name: 'Payments Service', url: 'https://api.example.com/payments/health' },
  { name: 'Invalid Service', url: 'https://api.example.com/nonexistent/health' }
];

async function runSmokeTests() {
  console.log('--- Starting API Smoke Tests ---');
  let allTestsPassed = true;

  for (const service of services) {
    try {
      const response = await axios.get(service.url, { timeout: 5000 });
      if (response.status === 200 && response.data.status === 'ok') {
        console.log(`✅ [SUCCESS] ${service.name} is healthy.`);
      } else {
        allTestsPassed = false;
        console.error(`❌ [FAILURE] ${service.name} returned status ${response.status} with body:`, response.data);
      }
    } catch (error) {
      allTestsPassed = false;
      console.error(`❌ [ERROR] ${service.name} failed to respond: ${error.message}`);
    }
  }

  console.log('--- Smoke Tests Complete ---');
  if (!allTestsPassed) {
    // Exit with a non-zero code to fail a CI/CD pipeline
    process.exit(1);
  }
}

runSmokeTests();
This script can be integrated directly into your CI/CD Debugging pipeline to act as a deployment gate, preventing a faulty service from reaching production.
Leveraging Headless Browsers for Frontend Debugging
For web applications, many bugs are specific to the user interface and browser environment. Manually testing every user flow in multiple browsers is untenable. This is where headless browser automation frameworks like Playwright, Puppeteer, and Selenium shine. These Web Development Tools allow you to script user interactions, perform assertions, and automatically capture diagnostic information when something goes wrong.
A powerful automation pattern is to automatically take a screenshot, save the DOM structure, and capture browser console logs at the exact moment a test fails. This gives developers a complete snapshot of the application’s state, dramatically reducing the time needed for Frontend Debugging.
const { test, expect } = require('@playwright/test');

test.describe('Login Flow', () => {
  test('should show an error message with invalid credentials', async ({ page }) => {
    // Set a custom handler for page errors to fail the test
    page.on('pageerror', (exception) => {
      console.error('Uncaught exception in page:', exception);
      test.fail(true, `Page threw an error: ${exception.message}`);
    });

    try {
      await page.goto('https://example.com/login');

      await page.fill('input[name="username"]', 'wrong-user');
      await page.fill('input[name="password"]', 'wrong-password');
      await page.click('button[type="submit"]');

      const errorMessage = page.locator('.error-message');
      await expect(errorMessage).toBeVisible({ timeout: 5000 });
      await expect(errorMessage).toHaveText('Invalid username or password.');

    } catch (error) {
      // On failure, capture diagnostic information
      const timestamp = new Date().toISOString().replace(/:/g, '-');
      const screenshotPath = `test-failures/login-failure-${timestamp}.png`;
      const htmlPath = `test-failures/login-failure-${timestamp}.html`;

      await page.screenshot({ path: screenshotPath, fullPage: true });
      const pageContent = await page.content();
      require('fs').writeFileSync(htmlPath, pageContent);

      console.error(`Test failed. Diagnostics saved:
      - Screenshot: ${screenshotPath}
      - HTML Dump: ${htmlPath}`);

      // Re-throw the error to ensure the test is marked as failed
      throw error;
    }
  });
});
This Playwright script for JavaScript Debugging not only validates functionality but also serves as a diagnostic tool, providing invaluable context for any JavaScript Errors that occur during the test run.
Advanced Techniques: From Triage to Self-Healing
True debug automation extends beyond simple tests. Advanced strategies involve integrating with sophisticated platforms and creating feedback loops that can triage issues, gather deeper context, and even involve humans when necessary.
Automated Triage with Error Monitoring Platforms

developer debugging code on screen – programmer coding, compiler, encode, debug, and developer …
Tools like Sentry, Bugsnag, and Datadog are essential for Production Debugging. They automatically capture, group, and enrich errors with context like the user’s browser, OS, and release version. The real power for automation lies in their APIs and webhook capabilities. You can configure these platforms to trigger automated workflows when a new or high-frequency error is detected. For example, a new exception in your payment service could automatically:
- Create a high-priority ticket in Jira with all the error details.
- Post a notification to a dedicated Slack channel with a link to the error.
- Trigger a diagnostic script to run a deeper set of tests on the affected service.
- Tag the release in your version control system as “unstable.”
This level of automation turns your error monitoring platform into an active participant in your debugging process.
Dynamic Analysis and Runtime Instrumentation
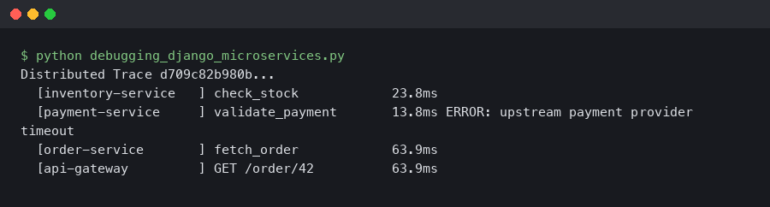
Sometimes, logs and stack traces aren’t enough. To understand complex performance issues or memory leaks, you need to see what’s happening inside the running application. Dynamic Analysis tools and instrumentation libraries like OpenTelemetry allow you to trace requests as they travel across multiple services (distributed tracing) and profile code execution to pinpoint bottlenecks.
You can create simple instrumentation yourself using decorators or higher-order functions to wrap critical parts of your code. This Python example shows a decorator that logs function execution time and arguments, a basic form of Performance Monitoring.
import time
import logging

# Assume logger is already configured (e.g., with JsonFormatter)
logger = logging.getLogger('PerformanceMonitor')

def performance_probe(func):
    def wrapper(*args, **kwargs):
        start_time = time.time()
        result = func(*args, **kwargs)
        end_time = time.time()

        logger.info(
            f"Function '{func.__name__}' executed in {end_time - start_time:.4f}s",
            extra={
                'function_name': func.__name__,
                'duration_sec': end_time - start_time,
                'args': args,
                'kwargs': kwargs
            }
        )
        return result
    return wrapper

@performance_probe
def fetch_user_data_from_db(user_id):
    # Simulate a database call
    time.sleep(0.5)
    return {"id": user_id, "name": "John Doe"}

fetch_user_data_from_db("user-456")
The Human-in-the-Loop (HITL) Model
The ultimate goal of debug automation is not to completely remove humans, but to empower them. A Human-in-the-Loop (HITL) approach recognizes that some decisions require human judgment. An automated system can detect an anomaly, gather all relevant data, and present a set of options to an engineer. For example, if an automated script detects a database corruption issue, it could:
- Lock the affected tables to prevent further damage.
- Gather logs from the database and all connected application services.
- Identify the last known good backup.
- Send a message to the on-call engineer’s Slack with a summary and two buttons: “Initiate Automated Rollback” or “Escalate to Senior DBA.”
This blend of automated diagnostics and human decision-making is crucial for safely managing complex, high-stakes systems.
Best Practices for a Robust Debug Automation Strategy
Implementing these techniques requires a thoughtful strategy to avoid creating more noise than signal. Here are some key best practices to follow.
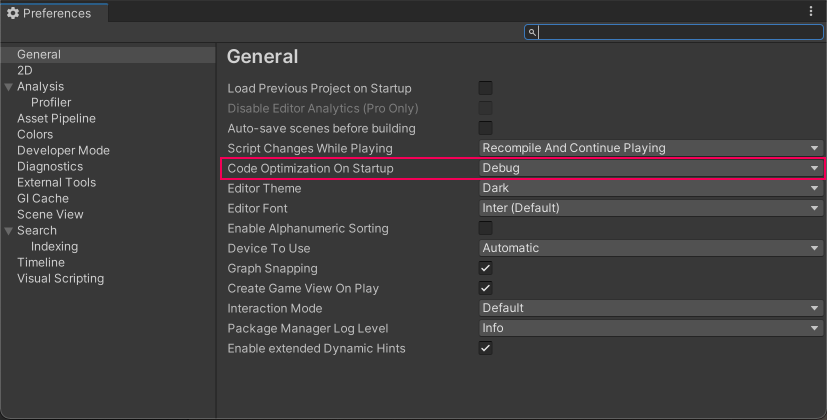
developer debugging code on screen – Debug C# code in Unity – Unity 手册
Integrate with Your CI/CD Pipeline
Debug automation should not be an afterthought. Embed your automated smoke tests, integration tests, and static analysis tools directly into your CI/CD pipeline. Make them a required check before any code can be merged or deployed. This creates a quality gate that catches bugs early in the development lifecycle, when they are cheapest and easiest to fix.
Avoid Common Pitfalls
- Alert Fatigue: Be selective about what triggers an alert. If everything is an emergency, nothing is. Fine-tune your thresholds to focus on actionable, high-impact issues.
- Brittle Scripts: Design your automation scripts to be resilient. Avoid relying on brittle selectors in UI tests (e.g., use `data-testid` attributes instead of CSS classes) and build retries into network requests.
- Ignoring the “Why”: Automation is excellent at identifying *what* broke and *where*. However, it often can’t tell you *why*. Ensure your processes still allocate time for engineers to perform deep root cause analysis.
Security Considerations
Be extremely careful about the data you log. Automated systems that collect and store logs can become a security risk if they contain sensitive information like passwords, API keys, or personally identifiable information (PII). Use log filtering and redaction tools to scrub sensitive data before it is stored.
Conclusion: Building Your Debugging Flywheel
Debug automation is an investment that pays compounding dividends. It’s a journey that begins with adopting structured logging and writing simple health checks, and evolves into a sophisticated system of automated diagnostics, intelligent alerting, and human-in-the-loop workflows. By automating the repetitive and tedious aspects of Software Debugging, you create a powerful flywheel: faster detection leads to faster resolution, which frees up developer time to build better features and, crucially, more robust automation. Start small. Pick one repetitive debugging task that consumes your team’s time—whether it’s checking API health after a deploy or manually testing a login form—and automate it. This first step will begin your team’s transformation from reactive firefighters to proactive system architects.