In the fast-paced world of software development, the pressure to ship features quickly can often lead to compromises in code quality, security, and maintainability. Bugs caught late in the development cycle or, worse, in production, are exponentially more expensive to fix. This is where the principle of “shifting left” comes into play—moving quality checks earlier in the process. At the heart of this philosophy lies a powerful and indispensable practice: static code analysis.
Static analysis is the process of examining source code without executing it. Unlike dynamic analysis, which observes program behavior at runtime, static analysis tools act like an automated, expert code reviewer, meticulously scanning your codebase for potential bugs, security vulnerabilities, performance bottlenecks, and stylistic inconsistencies. By integrating these tools directly into developer workflows and CI/CD pipelines, teams can catch issues at the earliest possible moment—often before the code is even committed. This proactive approach to Code Debugging not only saves time and resources but also fosters a culture of quality and security from the ground up, making it a cornerstone of modern Software Debugging and development.
The Foundations of Static Analysis
At its core, static analysis automates the enforcement of best practices and the detection of common programming errors. It provides a safety net that helps developers write cleaner, more secure, and more reliable code. To understand its power, we must first look at how it works and the tangible benefits it delivers.
How Static Analysis Works: Under the Hood
Static analysis tools don’t just read code as plain text. They parse it into a structured representation that allows for deep, programmatic inspection. The most common technique involves creating an Abstract Syntax Tree (AST). An AST is a tree-like representation of the source code’s structure, where each node represents a construct in the code, such as a function call, a variable declaration, or a loop.
Once the AST is built, tools can traverse it to:
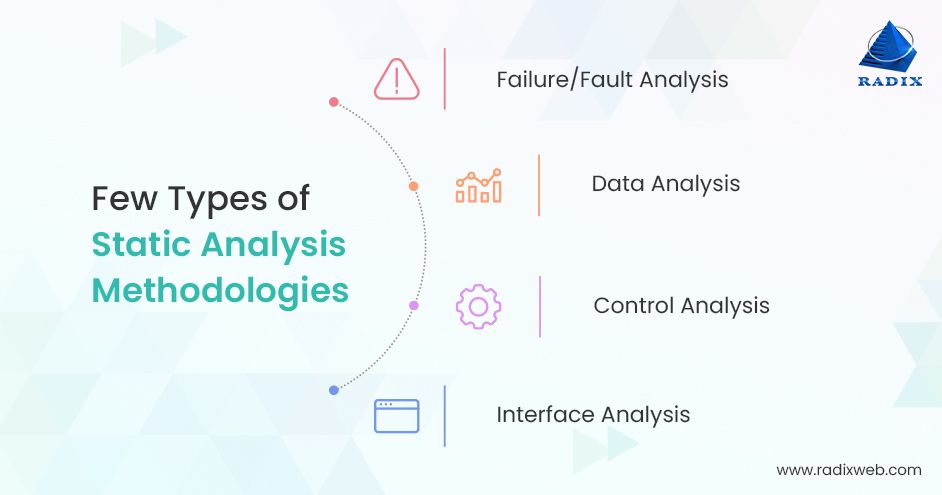
- Identify Patterns: They look for specific code patterns known to be problematic, such as using a deprecated function or writing an insecure database query.
- Analyze Control Flow: They build a Control-Flow Graph (CFG) to map all possible execution paths, helping to identify issues like unreachable code or unhandled exceptions.
- Analyze Data Flow: They track how data moves through the application, which is crucial for finding null pointer dereferences, resource leaks, and security vulnerabilities like data being “tainted” by user input.
This systematic Code Analysis allows tools to reason about the code’s properties and potential runtime behavior without ever running it.
Practical Example: Catching Bugs Early in Python
Consider a simple Python function designed to process user data. A developer might inadvertently introduce a common error, such as an unused variable or a mutable default argument, which can lead to unpredictable behavior. A static analysis tool like Pylint or Ruff can spot this instantly.
import os

# A common mistake: using a mutable list as a default argument
def add_user_to_group(user, group_members=[]):
    """Adds a user to a group."""
    api_key = os.getenv("API_KEY") # This variable is declared but never used
    group_members.append(user)
    print(f"User {user} added. Current members: {group_members}")
    return group_members

# Demonstrate the bug
group_a = add_user_to_group("Alice")
# Expected: ["Bob"]
# Actual: ["Alice", "Bob"]
group_b = add_user_to_group("Bob")
Running a static analyzer on this code would immediately flag two issues:
- Unused Variable: It would report that
api_keyis assigned a value but never used, a potential sign of dead code or an incomplete implementation. - Dangerous Default Value: It would warn that using a mutable type (like a list) as a default argument is risky. The list is created only once when the function is defined, not each time it’s called. This causes calls to share the same list, leading to the unexpected output shown in the comments. This is a classic Python Error that can be very tricky to debug manually.
Implementing Static Analysis in Your Workflow
The true value of static analysis is realized when it becomes a seamless and automated part of the development lifecycle. This involves selecting the right tools, configuring them effectively, and integrating them into your team’s daily routines.
Choosing and Configuring the Right Tools
The ecosystem of static analysis tools is vast. Some are language-specific linters focused on style and common errors, while others are comprehensive platforms that cover multiple languages and focus on deep security analysis.
- JavaScript/TypeScript: ESLint is the de facto standard for JavaScript Debugging and linting, highly configurable with a rich plugin ecosystem for frameworks like React (
eslint-plugin-react) and security (eslint-plugin-security). - Python: Pylint and Flake8 have been long-standing choices, but newer tools like Ruff are gaining massive popularity for their incredible speed and extensive rule sets.
- Java: Checkstyle enforces coding standards, while SpotBugs and PMD excel at finding common bug patterns.
- Multi-language Platforms: Tools like SonarQube, Codacy, and Snyk provide a centralized dashboard for analyzing code across multiple languages, tracking quality metrics over time, and performing sophisticated Security Analysis.
Configuration is key. Most tools use a configuration file (e.g., .eslintrc.js, pyproject.toml) to define which rules to enable and how to enforce them. This allows teams to tailor the analysis to their specific coding standards and project requirements.
// .eslintrc.js - Example configuration for a Node.js/Express project

module.exports = {
  env: {
    node: true,
    es2021: true,
    commonjs: true,
  },
  extends: [
    'eslint:recommended',
    'plugin:security/recommended', // Use security-focused rules
  ],
  parserOptions: {
    ecmaVersion: 'latest',
  },
  rules: {
    'no-console': 'warn', // Warn about console.log instead of erroring
    'no-unused-vars': ['error', { args: 'none' }], // Error on unused variables
    'security/detect-object-injection': 'error', // Flag potential object injection vulnerabilities
    'eqeqeq': ['error', 'always'], // Enforce the use of === over ==
  },
};
Integration with CI/CD Pipelines
To enforce quality consistently, static analysis must be automated. Integrating it into your Continuous Integration (CI) pipeline is the most effective way to do this. A typical setup involves adding a “lint” or “analyze” step that runs before the build or test steps. If the analysis tool finds critical issues, the pipeline fails, preventing flawed code from being merged or deployed.
Here’s a simple example of a GitHub Actions workflow that runs ESLint on a JavaScript project:
# .github/workflows/ci.yml

name: CI Pipeline

on: [push, pull_request]

jobs:
  lint-and-test:
    runs-on: ubuntu-latest

    steps:
      - name: Checkout code
        uses: actions/checkout@v3

      - name: Setup Node.js
        uses: actions/setup-node@v3
        with:
          node-version: '18'
          cache: 'npm'

      - name: Install dependencies
        run: npm ci

      - name: Run Static Analysis (ESLint)
        run: npm run lint # Fails the job if linting errors are found

      - name: Run Unit Tests
        run: npm test
Beyond Linting: Advanced Static Analysis Techniques
While basic linting is incredibly valuable, the field of static analysis extends to far more sophisticated techniques, particularly in the realm of application security and complex bug detection.
Taint Analysis for Security Vulnerabilities
One of the most powerful advanced techniques is taint analysis, also known as data flow analysis. It’s a cornerstone of modern security scanning. The process works by:
- Identifying Sources: Marking all sources of untrusted user input (e.g., HTTP request parameters, form data, database results) as “tainted.”
- Identifying Sinks: Marking all sensitive functions or operations where tainted data could cause harm (e.g., database query executors, file system writers, command-line executors) as “sinks.”
- Tracking Flow: Analyzing all possible code paths to see if any tainted data can reach a sensitive sink without being properly sanitized or validated first.
This technique is highly effective at detecting vulnerabilities like SQL Injection, Cross-Site Scripting (XSS), and Remote Code Execution. For example, it can trace a tainted string from an API request all the way to a raw SQL query.
// Example of a potential SQL Injection vulnerability in Java

import java.sql.Connection;
import java.sql.ResultSet;
import java.sql.Statement;
import javax.servlet.http.HttpServletRequest;

public class UserDAO {
    public ResultSet getUserByUsername(HttpServletRequest request, Connection connection) throws Exception {
        // SOURCE: 'username' is untrusted user input, so it's "tainted"
        String username = request.getParameter("username");

        // VULNERABLE SINK: Tainted data is used directly in a SQL query
        String query = "SELECT * FROM users WHERE username = '" + username + "'";

        Statement statement = connection.createStatement();
        return statement.executeQuery(query); // A security tool would flag this line
    }
}
The Challenge of False Positives and The Rise of AI
A significant challenge in static analysis is managing the signal-to-noise ratio. Tools can sometimes produce false positives (flagging safe code as problematic) or false negatives (missing an actual issue). False positives are particularly troublesome, as they can lead to “alert fatigue,” where developers start ignoring all warnings, including legitimate ones.
This is where the next frontier of static analysis is emerging: the integration of AI and Large Language Models (LLMs). Traditional tools rely on predefined rules and patterns, which can lack the context to understand a developer’s intent. Modern, AI-powered tools are changing the game by:
- Understanding Context: LLMs can analyze the surrounding code and developer comments to better determine if a potential issue is a true vulnerability or an intentional, safe pattern.
- Filtering False Positives: By learning from vast amounts of code and developer feedback, these models can intelligently suppress low-confidence or irrelevant findings, allowing teams to focus on what truly matters.
- Prioritizing Findings: AI can help prioritize alerts based on their likely impact and exploitability, guiding developers to fix the most critical issues first.
Maximizing Value: Best Practices and Common Pitfalls
To make static analysis a truly effective part of your Debugging Best Practices, it’s not enough to just turn on a tool. Adopting a strategic approach will ensure you get the most benefit without overwhelming your team.
Start Small and Iterate
When introducing static analysis to a large, existing codebase, enabling hundreds of rules at once can generate thousands of warnings, which is demoralizing and impractical. Instead, start with a small, core set of high-impact rules (e.g., those related to security and critical bugs). Fix the issues, then gradually enable more rules over time.
Customize Rulesets for Your Team
One size does not fit all. Work with your team to define a shared coding standard and configure your analysis tools to enforce it. This ensures consistency and reduces debates during code reviews. Suppress rules that are genuinely not applicable to your project to minimize noise.
Treat Critical Warnings as Errors in CI
For a rule to be effective, it must be enforced. Configure your CI/CD pipeline to treat violations of critical rules (especially security and major bug patterns) as build failures. This creates a hard gate that prevents serious issues from ever reaching production.
Combine with Other Quality Gates
Static analysis is a powerful tool, but it’s not a silver bullet. It excels at finding certain classes of errors but cannot understand business logic or runtime behavior. It should always be used as part of a comprehensive quality strategy that includes robust Unit Test Debugging, integration testing, and Dynamic Analysis.
Conclusion: Building a Culture of Quality
Static analysis has evolved from a niche tool for purists into an essential, mainstream practice for any team serious about software quality, security, and maintainability. By automating the detection of common errors and vulnerabilities, it empowers developers to catch and fix issues early, freeing up valuable time and mental energy to focus on building great features.
The key to success lies in thoughtful implementation: choosing the right tools, integrating them seamlessly into your workflow, and cultivating a team culture that values the feedback they provide. As the technology continues to advance with AI-driven enhancements that reduce noise and increase accuracy, static analysis is poised to become an even more intelligent and indispensable partner in the craft of software development. Start integrating it today to build a stronger, more secure, and more resilient codebase for tomorrow.