In modern software development, writing code that simply “works” is no longer enough. We need code that is maintainable, secure, efficient, and scalable. This is where code analysis comes in—a systematic examination of source code to discover and resolve issues without necessarily executing the program. It’s a foundational practice that separates good developers from great ones, transforming the development lifecycle from a reactive bug-fixing frenzy into a proactive process of building quality software. By embedding analysis directly into our workflows, we can catch errors early, optimize performance before it becomes a problem, and ensure our applications are robust and reliable. This article dives deep into the world of code analysis, exploring the core concepts, practical tools, and advanced techniques that every developer should master.
The Two Pillars of Code Analysis: Static vs. Dynamic
Code analysis is broadly divided into two categories: static analysis and dynamic analysis. While they serve different purposes, they are complementary parts of a comprehensive quality assurance strategy. Understanding both is crucial for building high-quality software.
Static Code Analysis: Your Proactive Quality Gate
Static Application Security Testing (SAST), or static analysis, is the process of analyzing source code before it is run. It’s like having an expert programmer review every line of code you write, instantly pointing out potential problems. This type of analysis is incredibly powerful for catching common mistakes, enforcing coding standards, and identifying security vulnerabilities early in the development cycle.
Tools that perform static analysis, often called “linters,” can detect a wide range of issues:
- Code Smells: overly complex functions, long parameter lists, or duplicated code.
- Potential Bugs: unused variables, unreachable code, or potential null pointer exceptions.
- Style Violations: inconsistent naming conventions or formatting that violates team standards.
- Security Vulnerabilities: common weaknesses like SQL injection or cross-site scripting (XSS) patterns.
For Python developers, Pylint is an indispensable tool. It’s a highly configurable linter that checks for programming errors, helps enforce a coding standard, and sniffs for code smells. Let’s look at a practical example of how it can improve code quality.
Consider this simple Python script with several subtle issues:
# bad_code.py
import sys

def process_data(data, threshold):
    results = []
    for item in data:
        # Unused variable 'i' from enumerate
        for i, value in enumerate(item):
            if value > threshold:
                # Inefficiently re-calculating the same value
                processed_val = value * 2 + 5
                results.append(processed_val)
    # The variable 'sys' is imported but not used
    return results

def another_function():
    # This function is never called in the script
    print("This does something.")

my_data = [[1, 5, 10], [20, 3, 8]]
process_data(my_data, 7)
Running Pylint on this file (pylint bad_code.py) would produce a report highlighting these problems, such as “unused-variable”, “unused-import”, and “redefined-outer-name”. By addressing Pylint’s feedback, we arrive at a much cleaner, more maintainable version:
# good_code.py
"""
A module for processing numerical data.
"""

def process_data(data, threshold):
    """
    Processes a list of lists, returning values above a threshold.

    Args:
        data (list[list[int]]): The input data.
        threshold (int): The value to compare against.

    Returns:
        list[int]: A list of processed values.
    """
    results = []
    for item_list in data:
        for value in item_list:
            if value > threshold:
                processed_val = value * 2 + 5
                results.append(processed_val)
    return results

def main():
    """Main execution function."""
    my_data = [[1, 5, 10], [20, 3, 8]]
    processed_results = process_data(my_data, 7)
    print(f"Processed results: {processed_results}")

if __name__ == "__main__":
    main()
This revised code is not only free of linting errors but is also more readable and follows Python development best practices, such as using a main function guard.
Code in Motion: Uncovering Issues with Dynamic Analysis
While static analysis examines code at rest, dynamic analysis inspects code during execution. This approach is essential for finding issues that only manifest at runtime, such as performance bottlenecks, memory leaks, and concurrency problems. Dynamic analysis tools, including profilers and memory debuggers, provide deep insights into how your application actually behaves with real data.
Profiling for Performance Bottlenecks
A profiler is a tool that measures the performance of an application, typically by tracking function call frequency and execution time. This helps you identify “hot spots”—the small sections of code that consume the most resources. Optimizing these areas can lead to significant performance gains across the entire application.
Python’s built-in cProfile module is a powerful tool for performance monitoring. Let’s analyze a function that has a clear performance issue: inefficient string concatenation.
# performance_issue.py
import cProfile

def create_long_string_bad(n):
    """Creates a long string by inefficiently concatenating in a loop."""
    long_string = ""
    for i in range(n):
        long_string += str(i)
    return long_string

def create_long_string_good(n):
    """Creates a long string efficiently using a list join."""
    return "".join([str(i) for i in range(n)])

def main():
    """Runs the profiling."""
    print("Profiling the bad implementation...")
    cProfile.run('create_long_string_bad(100000)', sort='tottime')

    print("\nProfiling the good implementation...")
    cProfile.run('create_long_string_good(100000)', sort='tottime')

if __name__ == "__main__":
    main()
Running this script will show a dramatic difference. The output for create_long_string_bad will reveal that the vast majority of time is spent on string concatenation operations. In contrast, the profile for create_long_string_good will be significantly faster because the join method is highly optimized for this task. This is a classic example of how dynamic analysis helps pinpoint and validate performance optimizations.
Memory Debugging and Leak Detection
Memory leaks are a pernicious type of bug where an application fails to release memory it no longer needs. Over time, this can lead to degraded performance and eventual crashes. Dynamic analysis tools are essential for memory debugging. For languages like C/C++, Valgrind is the gold standard. For managed languages like JavaScript (Node.js) and Python, built-in developer tools and libraries like mem-prof or Chrome DevTools’ Memory tab are used to take heap snapshots and identify objects that are not being properly garbage collected.
Advanced Techniques and Modern Workflows
Effective code analysis isn’t just about running a tool occasionally; it’s about integrating it into your daily development workflow. Modern CI/CD (Continuous Integration/Continuous Deployment) pipelines provide the perfect framework for automating code analysis and making it a non-negotiable part of your process.
Automating Analysis in CI/CD
By integrating analysis tools into your CI/CD pipeline, you can create a powerful quality gate. Here’s a typical workflow:
- Pre-commit Hooks: Run linters and formatters automatically before a developer can even commit their code. This ensures a baseline of code quality and style consistency.
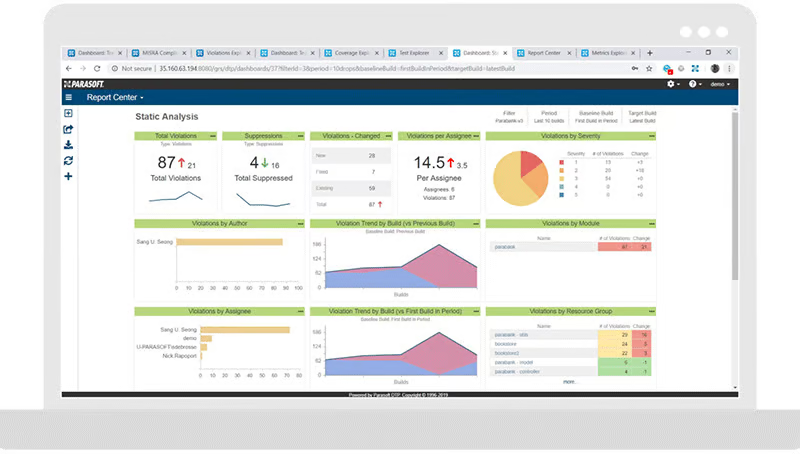
- Pull Request Checks: When a pull request is opened, the CI server automatically runs a more comprehensive suite of static analysis tools (like SonarQube or ESLint) and unit tests. The pull request can be blocked from merging if it fails to meet the defined quality threshold.
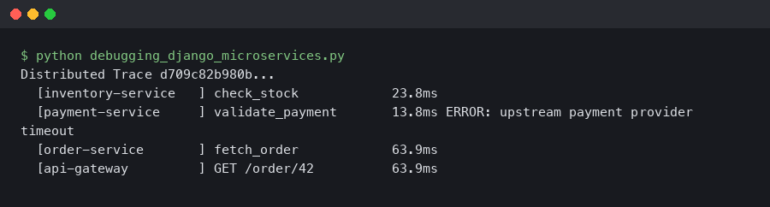
- Staging Environment Tests: After merging, the code is deployed to a staging environment where dynamic analysis can occur. This includes running integration tests, performance load tests, and API debugging to catch runtime issues before they reach production.
Diagnosing Node.js Performance with Clinic.js
In the world of Node.js development, asynchronous operations can make performance debugging tricky. An event loop that is blocked by long-running synchronous code can bring an entire server to a halt. Tools like Clinic.js are designed specifically for dynamic analysis of Node.js applications.

Consider a simple Express.js server with a route that performs a CPU-intensive, blocking operation:
// server.js
const express = require('express');
const app = express();
const port = 3000;

// A computationally expensive, blocking function
function blockingOperation() {
  let count = 0;
  // This loop will block the event loop for a noticeable time
  for (let i = 0; i < 1e9; i++) {
    count++;
  }
  return count;
}

app.get('/', (req, res) => {
  res.send('Hello, this is a fast route!');
});

app.get('/slow', (req, res) => {
  const result = blockingOperation();
  res.send(`Slow route finished. Result: ${result}`);
});

app.listen(port, () => {
  console.log(`Server listening at http://localhost:${port}`);
});
If you run this server and hit the /slow endpoint, all other requests to / will be blocked until the expensive operation completes. To diagnose this, you could use Clinic.js Doctor. You would run your server with it (e.g., clinic doctor -- node server.js) and then generate some traffic. Clinic.js would produce an HTML report visualizing the event loop delay, CPU usage, and memory, clearly pointing to the blockingOperation function as the culprit. This type of dynamic analysis is invaluable for maintaining a responsive backend.
Best Practices for Effective Code Analysis
To get the most out of code analysis, it’s important to follow a few key best practices.
1. Start Early and Analyze Often
Don’t wait until the end of a project to run your analysis tools. Integrate them from day one. The earlier you catch an issue, the cheaper and easier it is to fix.
2. Automate Everything
Manual analysis is prone to human error and is not scalable. Use CI/CD pipelines, pre-commit hooks, and IDE integrations to make analysis an automatic and unavoidable part of your workflow.
3. Customize Rules to Fit Your Context
Out-of-the-box configurations for tools like ESLint or Pylint are a great starting point, but they may not be perfect for your project. Take the time to customize the ruleset to suppress irrelevant warnings and enforce standards that are important to your team.
4. Combine Static, Dynamic, and Manual Analysis
No single tool or technique can find every bug. Use a layered approach. Static analysis catches structural problems, dynamic analysis finds runtime issues, and manual code reviews by peers can uncover logical errors and design flaws that automated tools might miss.
5. Don’t Ignore the Warnings
It can be tempting to let warnings pile up, creating “analysis debt.” Treat warnings as potential bugs and address them promptly. A clean analysis report should be a source of team pride.
Conclusion: Building Better Software Through Analysis
Code analysis is a fundamental discipline that elevates software development from a craft to an engineering practice. By systematically examining our code both at rest with static analysis and in motion with dynamic analysis, we can build applications that are more than just functional—they are robust, secure, and performant. Integrating tools like Pylint, ESLint, cProfile, and Clinic.js into an automated CI/CD pipeline creates a powerful feedback loop that catches issues early and enforces a high standard of quality. Ultimately, embracing a culture of continuous analysis empowers development teams to ship better products faster, with greater confidence and fewer production surprises.