In the intricate world of modern software development, developer tools are not just a convenience; they are the bedrock of productivity, quality, and innovation. From browser-based inspectors to sophisticated IDE debuggers and performance profilers, these instruments provide the visibility and control needed to build, analyze, and repair complex applications. They are the digital equivalent of a mechanic’s workshop, equipped with everything needed to diagnose a sputtering engine or fine-tune it for maximum output. However, like any powerful tool, they come with their own set of considerations. The very act of observing a system can alter its behavior, a phenomenon particularly evident in application performance. Understanding this duality—the immense power of developer tools versus their potential performance overhead—is crucial for any developer aiming to write efficient, robust, and reliable code. This article delves into the world of developer tools, exploring their core functions, hidden costs, and the best practices that enable you to wield them effectively without falling prey to their pitfalls.
The Core Toolkit: A Tour of Essential Developer Instruments
At its heart, software development is a cycle of writing, testing, and debugging. Developer tools are designed to streamline every phase of this cycle. While the ecosystem is vast, a few core categories form the foundation of nearly every developer’s workflow, from frontend web development to backend microservices.
Browser-Based Debugging: The Frontend Cornerstone
For anyone working on the web, the browser’s built-in developer tools are the first port of call. Chrome DevTools, Firefox Developer Tools, and Safari’s Web Inspector are sophisticated suites that offer deep insights into what’s happening on the client side. Key panels include:
- Elements Panel: Allows for live inspection and manipulation of the DOM and CSS, making UI tweaks and layout debugging an interactive process.
- Console: More than just a place for
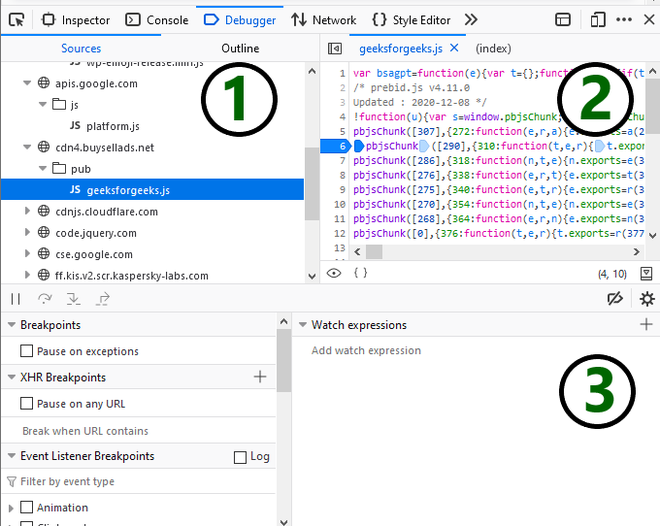
console.log(), it’s a full REPL (Read-Eval-Print Loop) for executing JavaScript, inspecting objects, and tracking errors and warnings. - Sources Panel: A powerful JavaScript debugger. Here you can set breakpoints, step through code execution, inspect the call stack, and observe variable scope in real-time. This is fundamental for any serious JavaScript Debugging.
- Network Panel: Provides a detailed waterfall view of all network requests, allowing you to inspect headers, payloads, and timings for API Debugging and asset loading optimization.
A fundamental debugging technique is using breakpoints. Instead of littering your code with logs, you can pause execution at a specific line to inspect the application’s state.
// script.js
function calculateTotal(items) {
    let total = 0;
    items.forEach(item => {
        // Set a breakpoint on the next line in the Sources panel
        // to inspect the 'item' and 'total' variables on each iteration.
        total += item.price * item.quantity;
    });
    return total;
}

const cart = [
    { name: 'Apple', price: 0.5, quantity: 4 },
    { name: 'Banana', price: 0.25, quantity: 6 },
    { name: 'Orange', price: null, quantity: 3 } // Potential bug here
];

const finalTotal = calculateTotal(cart);
console.log(`Final total: $${finalTotal.toFixed(2)}`);
IDE and Backend Debugging
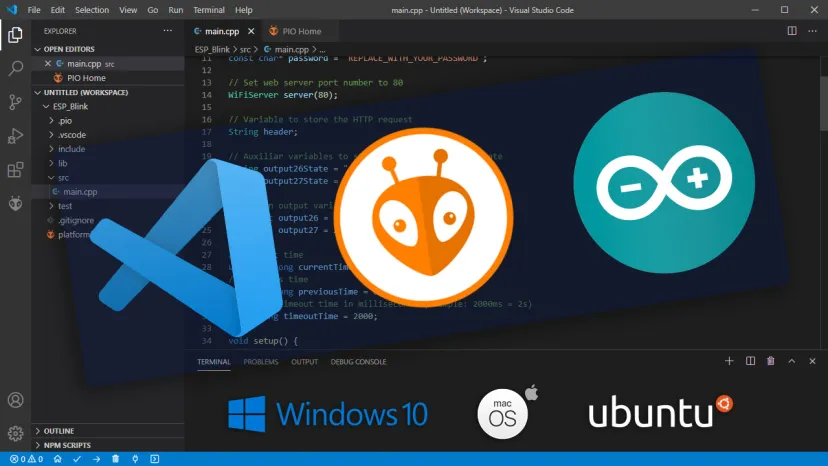
For backend services, the debugger is typically integrated into the Integrated Development Environment (IDE). Tools like Visual Studio Code, JetBrains IntelliJ/PyCharm, and Eclipse provide robust Code Debugging capabilities for languages like Node.js, Python, Java, and Go. These debuggers allow you to do everything a browser debugger can, but on your server-side code. A common setup in VS Code for a Node.js application involves a launch.json file to configure the debugger.
// .vscode/launch.json
{
    "version": "0.2.0",
    "configurations": [
        {
            "type": "node",
            "request": "launch",
            "name": "Launch Express Server",
            "program": "${workspaceFolder}/server.js",
            "skipFiles": [
                "/**"
            ]
        }
    ]
}
This configuration tells VS Code how to start the application in debug mode. Once running, you can set breakpoints directly in your editor, inspect variables, and step through complex logic, making Node.js Debugging or Python Debugging a seamless part of the development workflow.
Framework-Specific Tooling
Modern frontend frameworks like React, Vue, and Angular have their own ecosystems, including dedicated developer tools. React Developer Tools and Vue.js devtools are browser extensions that provide a higher level of abstraction. Instead of just seeing DOM elements, you can inspect the component hierarchy, view component props and state, and track state changes over time. This context is invaluable for React Debugging, as it aligns the debugging experience with the mental model of the framework.
The Hidden Cost: Performance Overhead of Instrumentation
Developer tools are not passive observers. To provide their rich insights, they must “instrument” the code. This means they inject their own logic or hook into the JavaScript engine and browser rendering pipeline to record data, track events, and intercept function calls. This instrumentation, while essential for debugging, consumes CPU cycles and memory, creating a performance overhead that can be misleading.
Measuring the Impact of Tooling
The difference in performance can be stark. A computationally intensive task or a large number of frequent, small operations (like setting thousands of timers) can be significantly slower when developer tools are open and active. This is because each operation might be logged, its stack trace captured, and its impact on the component tree analyzed by the tool. Let’s demonstrate this with a simple benchmark.
function runPerformanceTest() {
    console.clear();
    const iterations = 1000000;

    console.log('Starting performance test...');
    const startTime = performance.now();

    // A simple, repetitive task
    let result = 0;
    for (let i = 0; i < iterations; i++) {
        result += Math.sqrt(i);
    }

    const endTime = performance.now();
    const duration = endTime - startTime;

    console.log(`Test completed in ${duration.toFixed(2)} ms.`);
    console.log(`Result (to prevent optimization): ${result}`);

    // Display result on the page
    document.getElementById('result').innerText = `The test took ${duration.toFixed(2)} ms to complete. Try running it with DevTools closed vs. open.`;
}

// Attach to a button in your HTML
// <button onclick="runPerformanceTest()">Run Test</button>
// <p id="result"></p>
Run this test in your browser. First, run it with the DevTools panel completely closed. Note the time. Then, open DevTools (especially the Performance or Memory panel) and run it again. You will likely observe a noticeable increase in the execution time. This discrepancy is the overhead of instrumentation. For framework-specific tools like React DevTools, this effect can be even more pronounced during rapid state updates, as the tool works hard to track every change and render the component tree for inspection.
Advanced Debugging and Profiling Techniques
Beyond basic breakpoints and logging, professional-grade developer tools offer advanced features for tackling the most elusive bugs and performance bottlenecks. Mastering these is key to becoming a more effective developer.
Memory Leak Detection
A memory leak occurs when an application allocates memory but fails to release it when it's no longer needed, leading to bloating and eventual crashes. Chrome DevTools' Memory panel is a powerful ally in hunting down these issues. The primary technique is to take heap snapshots. You can take a snapshot of the memory heap, perform an action in your app that you suspect is causing a leak, and then take a second snapshot. By comparing the two, you can identify objects that were created but not subsequently garbage collected.
A common source of memory leaks in JavaScript is an event listener that is never removed from an element that is later deleted from the DOM.
function createLeakyElement() {
    const leakyElement = document.createElement('div');
    leakyElement.innerText = 'I am a leaky element.';
    document.body.appendChild(leakyElement);

    // This event listener holds a reference to leakyElement.
    // If the element is removed from the DOM without removing the listener,
    // the element may not be garbage collected.
    window.addEventListener('resize', () => {
        console.log(`Width is: ${leakyElement.offsetWidth}`);
    });

    return leakyElement;
}

let currentElement = createLeakyElement();

// Later, we replace the element but forget to remove the old listener
function replaceElement() {
    if (currentElement) {
        // We should call window.removeEventListener here!
        currentElement.remove();
    }
    currentElement = createLeakyElement();
}
Performance Profiling and Flame Charts
When your application feels sluggish, the Performance panel is your best friend. By recording a profile of your application as it runs, you can get a detailed breakdown of all activity on the browser's main thread. This is often visualized as a "flame chart," which shows the call stack over time. Long, wide blocks in the chart represent "Long Tasks"—JavaScript functions that monopolize the main thread and prevent the browser from responding to user input, leading to a janky user experience. Profiling helps you pinpoint exactly which functions are the culprits, enabling targeted optimization. This is a core practice for both Web Debugging and Performance Monitoring.
Remote and Containerized Debugging
Modern development often involves running applications inside Docker containers or on remote servers. Remote Debugging allows you to connect your local IDE's debugger to that remote process. For Node.js, this is achieved by starting the Node process with an `--inspect` flag, which opens a debugging port. Your IDE can then attach to that port, giving you full debugging capabilities as if the code were running locally. This is indispensable for Docker Debugging and diagnosing issues in staging or testing environments.
// .vscode/launch.json configuration for attaching to a remote Node.js process
{
    "type": "node",
    "request": "attach",
    "name": "Attach to Remote",
    "address": "localhost", // or the remote server's IP address
    "port": 9229, // Default Node.js inspect port
    "localRoot": "${workspaceFolder}",
    "remoteRoot": "/usr/src/app", // The path to the code inside the container
    "skipFiles": [
        "/**"
    ]
}
Best Practices for Efficient and Accurate Development
To harness the power of developer tools without being misled by their side effects, it's essential to adopt a strategic and mindful approach.
- Isolate Performance Testing: Never trust performance metrics gathered while heavy debugging tools are active. For accurate measurements, run your code in a clean environment: a browser's incognito mode with extensions disabled, or better yet, a production build of your application.
- Use Conditional Tooling: Many debugging libraries and verbose logging setups should only be included in your development builds. Use environment variables (e.g.,
process.env.NODE_ENV === 'development') to conditionally enable these features, ensuring they are stripped from your production code. - Leverage Production-Safe Monitoring: For Production Debugging and Error Tracking, use specialized services like Sentry, Datadog, or LogRocket. These tools are engineered for minimal performance overhead and provide invaluable insights into how your application behaves for real users.
- Prefer Logpoints to `console.log`: Instead of permanently adding `console.log` statements to your code, use "logpoints" (or conditional breakpoints) in your debugger. These are breakpoints that log a message to the console and continue execution without pausing, and they can be added and removed without modifying your source code.
- Know When to Disable: If you're not actively debugging a specific part of your application, consider disabling more intensive tools. For example, turn off the React DevTools profiler or close the DevTools panel entirely when focusing on tasks that don't require them.
Conclusion
Developer tools are an undeniable force multiplier in software engineering. They transform the abstract world of code into a tangible, observable system, enabling us to squash bugs, optimize performance, and build with confidence. However, their power comes with the responsibility of understanding their impact. The instrumentation that makes them so useful can also skew performance metrics and slow down the development environment.
The path to mastery lies in balance. By embracing a core set of browser and IDE tools, exploring advanced techniques like memory profiling and remote debugging, and adhering to best practices, you can navigate this duality. Learn to trust your tools for debugging logic but verify performance in a pristine environment. Use their full power when you need it, but be mindful of their presence when you don't. By treating your developer tools as the sharp, precise instruments they are, you can build better, faster, and more reliable software.