In the lifecycle of software development, writing code is often the easy part. The true test of engineering mettle arises when things go wrong. Application debugging is not merely about fixing syntax errors; it is a complex discipline that requires a deep understanding of system architecture, logic flow, and state management. As modern applications shift from monolithic structures to distributed microservices and serverless functions, the complexity of identifying the root cause of a bug has increased exponentially.
Effective debugging separates senior developers from juniors. It involves a systematic process of hypothesis, testing, and resolution. Whether you are engaged in frontend JavaScript development, backend Python development, or orchestrating containers in Kubernetes, the principles of visibility and observability remain paramount. Without the right tools and strategies, developers are essentially flying blind, relying on intuition rather than data.
This comprehensive guide explores advanced application debugging techniques. We will move beyond basic print statements to explore structured logging, remote debugging, and handling complex data scenarios in production environments. By mastering these concepts, you can significantly reduce Mean Time to Resolution (MTTR) and build more resilient software.
The Foundations of Effective Debugging: Beyond Print Statements
The most common starting point for any developer is the humble print statement. While console.log in Node.js or print() in Python are useful for quick local checks, they are detrimental in production debugging. They lack context, severity levels, and structure, making them impossible to query effectively in log aggregation tools like Splunk or the ELK stack.
Structured Logging and Severity Levels
To achieve true observability, developers must adopt structured logging. This involves outputting logs in a machine-readable format (usually JSON) rather than plain text. Structured logs allow you to filter by specific fields such as user_id, request_id, or error_code. Furthermore, utilizing proper logging levels (DEBUG, INFO, WARN, ERROR, FATAL) allows operations teams to filter noise and focus on critical system debugging events.
In Python debugging, the standard logging library is powerful but requires configuration to output JSON. This is critical for backend debugging where parsing text logs at scale is inefficient.
import logging
import json
import sys

class JsonFormatter(logging.Formatter):
    def format(self, record):
        log_record = {
            "level": record.levelname,
            "message": record.getMessage(),
            "timestamp": self.formatTime(record, self.datefmt),
            "module": record.module,
            "line": record.lineno
        }
        # Include exception info if present
        if record.exc_info:
            log_record["exception"] = self.formatException(record.exc_info)
        return json.dumps(log_record)

# Configure the logger
logger = logging.getLogger("AppLogger")
handler = logging.StreamHandler(sys.stdout)
handler.setFormatter(JsonFormatter())
logger.addHandler(handler)
logger.setLevel(logging.DEBUG)

def process_transaction(transaction_id, amount):
    logger.info(f"Processing transaction {transaction_id}")

    if amount < 0:
        logger.error(f"Invalid amount for transaction {transaction_id}: {amount}")
        return False

    # Simulate processing
    logger.debug(f"Transaction {transaction_id} committed to database")
    return True

# Example Usage
process_transaction("TXN-12345", 500)
process_transaction("TXN-67890", -50)
In the example above, the output is a JSON string. When this application runs in a Docker container or a Kubernetes pod, log collectors (like Fluentd) can easily parse these JSON objects, allowing you to build dashboards based on specific error messages or transaction IDs. This is a fundamental step in modern software debugging.
Frontend and Asynchronous Debugging Techniques
Frontend debugging presents a unique set of challenges. Unlike the controlled environment of a backend server, frontend code runs on user devices with varying browsers, network speeds, and screen sizes. JavaScript debugging has evolved significantly with the introduction of Chrome DevTools and other browser-based developer tools.
Mastering Async and Network Debugging
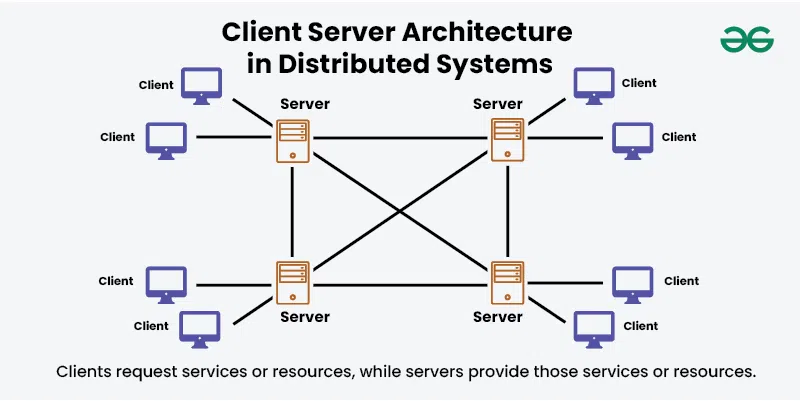
One of the most difficult aspects of JavaScript development is handling asynchronous operations. When an API call fails or a Promise rejects unexpectedly, the stack trace can often be misleading or incomplete. Modern debugging best practices involve using the debugger statement strategically and understanding how to pause execution within async/await blocks.
Network debugging is also crucial. Developers should not only look at the console but also inspect the “Network” tab to view request headers, response payloads, and status codes. However, relying solely on the network tab can be tedious. Integrating robust error handling directly into your data fetching logic provides better visibility.
async function fetchDataWithDiagnostics(url, retries = 3) {
    try {
        console.time(`Fetch-${url}`); // Performance monitoring
        const response = await fetch(url);

        if (!response.ok) {
            // Attach metadata for easier debugging
            const errorInfo = {
                status: response.status,
                statusText: response.statusText,
                url: response.url,
                timestamp: new Date().toISOString()
            };

            // In a real app, send this to an error tracking service like Sentry
            console.error("API Error Details:", JSON.stringify(errorInfo, null, 2));
            throw new Error(`HTTP error! status: ${response.status}`);
        }

        const data = await response.json();
        console.timeEnd(`Fetch-${url}`);
        return data;

    } catch (error) {
        // Breakpoint triggers here only if DevTools is open
        debugger;

        console.error("Network Debugging Failure:", error.message);

        if (retries > 0) {
            console.warn(`Retrying... attempts left: ${retries}`);
            return await fetchDataWithDiagnostics(url, retries - 1);
        }
        throw error;
    }
}

// Usage
fetchDataWithDiagnostics('https://api.example.com/data');
This JavaScript snippet demonstrates several key concepts: performance monitoring with console.time, structured error logging, retry logic, and the use of the debugger keyword to pause execution context specifically when an error occurs. This allows you to inspect the call stack and variable states at the exact moment of failure.
Advanced Strategies: Handling Large Data and State
As applications scale, integration developers often face a specific, tricky problem: debugging large data payloads. In API development and microservices debugging, passing massive JSON objects (such as complex e-commerce orders or data synchronization payloads) is common. However, logging these entire payloads to standard output is a bad practice.
The “Claim Check” Pattern for Debugging Data
When variables grow too large, logging systems often truncate the message to save storage and bandwidth. This results in “loss of visibility,” where the exact part of the data causing the bug is cut off from the logs. Furthermore, logging megabytes of data slows down the application and increases costs significantly.
A robust best practice for this scenario is to offload the large payload to an object store (like Google Cloud Storage, AWS S3, or Azure Blob Storage) and log only the reference URL. This technique, often called the “Claim Check” pattern in integration patterns, ensures that you have full robust data inspection capabilities without clogging your logging pipeline. You can then download the specific payload from storage to reproduce the issue locally.
Here is a Node.js debugging example demonstrating how to intercept a large response, store it externally if it exceeds a size threshold, and keep the logs clean.
const fs = require('fs');
// Mocking a cloud storage upload function
const uploadToCloudStorage = async (data, id) => {
    console.log(`Uploading payload ${id} to GCS/S3...`);
    // In reality, use AWS SDK or Google Cloud Storage client here
    return `https://storage.googleapis.com/debug-bucket/${id}.json`;
};

const logPayloadSafely = async (payload, contextId) => {
    const payloadString = JSON.stringify(payload);
    const sizeInBytes = Buffer.byteLength(payloadString, 'utf8');
    const SIZE_THRESHOLD = 1024 * 5; // 5KB threshold

    if (sizeInBytes > SIZE_THRESHOLD) {
        try {
            // Offload large data to storage for inspection
            const storageUrl = await uploadToCloudStorage(payload, contextId);

            // Log the reference, not the data
            console.log(JSON.stringify({
                level: "INFO",
                message: "Payload too large for logs. Offloaded to storage.",
                payload_reference: storageUrl,
                payload_size_bytes: sizeInBytes,
                context_id: contextId
            }));
        } catch (uploadError) {
            console.error("Failed to offload debug data", uploadError);
        }
    } else {
        // Safe to log directly
        console.log(JSON.stringify({
            level: "INFO",
            message: "Payload processed",
            payload: payload,
            context_id: contextId
        }));
    }
};

// Simulation
const massivePayload = { data: Array(1000).fill("complex_data_structure") };
logPayloadSafely(massivePayload, "req-998877");
This approach transforms system debugging. Instead of guessing what was in the truncated log, developers can click the link, download the exact JSON state that caused the error, and feed it into their unit test debugging environment to reproduce the bug instantly.
Remote Debugging and Containerization
In the era of Docker and Kubernetes, bugs often appear only in the containerized environment and cannot be reproduced on a local machine due to environmental differences. This necessitates remote debugging. Remote debugging allows you to attach your local IDE (like VS Code or IntelliJ) to a process running inside a Docker container or a remote server.
Configuring Docker for Inspection
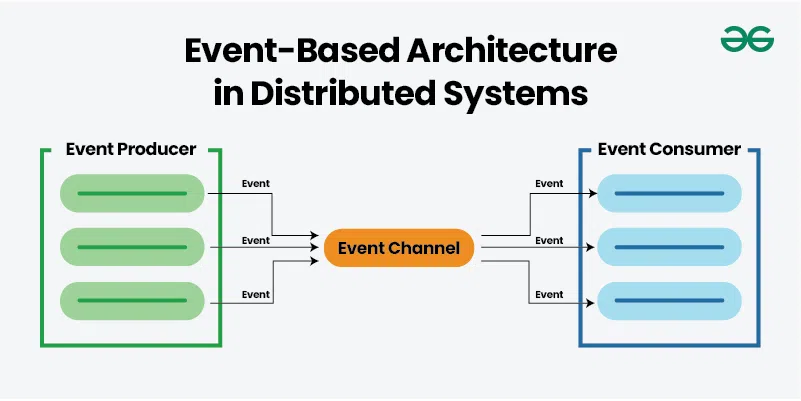
To enable this, you must expose specific debug ports and start your application with inspection flags. For Node.js development, this is done using the --inspect flag. For Java, it involves the JDWP agent. Security is paramount here; never expose debug ports to the public internet.
Below is an example of a Dockerfile and docker-compose setup configured for attaching a debugger to a Node.js application.
# docker-compose.yml
version: '3.8'
services:
  api-service:
    build: .
    ports:
      - "3000:3000"
      - "9229:9229" # Expose the debug port
    environment:
      - NODE_ENV=development
    command: ["node", "--inspect=0.0.0.0:9229", "index.js"]
    volumes:
      - .:/usr/src/app # Mount code for live reloading
With this configuration, you can configure VS Code’s launch.json to “Attach” to port 9229. This enables you to set breakpoints in your local editor that trigger when the code executes inside the Docker container. This is invaluable for full stack debugging where the interaction between services (like Redis or Postgres running in other containers) causes unexpected behavior.
Best Practices and Optimization for Production
Debugging does not end when the code is deployed. Production debugging requires a proactive approach to error monitoring and performance analysis. Here are key best practices to ensure maintainability and rapid bug fixing.
1. Centralized Error Tracking
Never rely solely on log files. Use specialized error tracking tools like Sentry, Rollbar, or Datadog. These tools aggregate duplicate errors, provide stack traces mapped to your original source code (via Source Maps), and alert you to spikes in error rates. They turn raw data into actionable insights.
2. Correlate Logs with Distributed Tracing
In microservices debugging, a single user request might touch five different services. If Service C fails, looking at Service A’s logs won’t help. Implement Distributed Tracing (using OpenTelemetry, Jaeger, or Zipkin). Ensure every request generates a unique Trace ID at the ingress point and passes it to all downstream services. Include this ID in every log message.
3. Sanitize Data (PII Protection)
While we discussed offloading large payloads for inspection, you must be vigilant about Personally Identifiable Information (PII). Debugging tools should never store passwords, credit card numbers, or sensitive user data. Implement “redaction” filters in your logging middleware to scrub sensitive fields before they leave the application.
Conclusion
Application debugging is a multifaceted skill that bridges the gap between code logic and system reality. From utilizing structured logging in Python to managing asynchronous states in JavaScript, and offloading massive payloads to cloud storage for deep inspection, the techniques discussed here form the backbone of modern software engineering reliability.
As you advance in your career, move away from reactive debugging—fixing things only when they break—to proactive observability. By implementing robust logging strategies, remote debugging capabilities, and automated error tracking, you transform the chaotic process of bug fixing into a streamlined, scientific workflow. The future of debugging lies in better data visibility; ensure your applications are built to provide it.

