A single synchronous JSON.parse on a 40 MB payload will freeze a Node.js process hard enough that a Kubernetes liveness probe starts firing. The request that triggered it completes fine. The next fifty requests queue behind it, their latencies spike, and your dashboards show a mystery: CPU is barely at 20%, memory looks flat, and yet p99 response time just crossed two seconds. This is event loop lag, and it is the single hardest performance problem to diagnose in Node.js because none of the classic Unix tools know the event loop exists.
clinic.js Doctor is the tool built for exactly this. It is a diagnostic wrapper from NearForm that runs your process, collects metrics from V8 and libuv, then tells you in plain English which of four buckets your performance problem lives in: event loop delay, I/O, garbage collection, or CPU. If you are trying to diagnose node event loop lag, clinic Doctor is the first thing to reach for, and this guide walks through how to read its output properly instead of staring at the pretty charts hoping the answer appears.
What clinic Doctor actually measures
Doctor is not a profiler in the flamegraph sense. It is a heuristic engine. It runs your Node process under instrumentation, samples four signals at fixed intervals, and then applies a decision tree to recommend what to investigate next. The four signals are:
- Event loop delay — the gap between when a
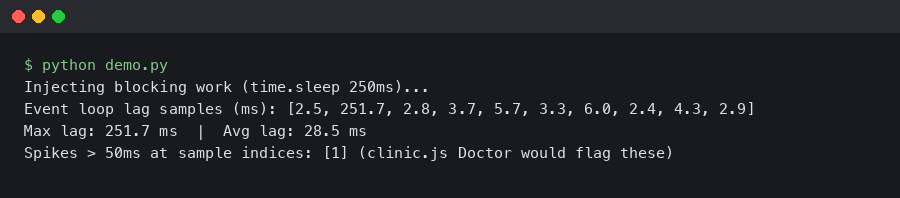
setImmediatecallback was scheduled and when it actually ran. Anything over ~10 ms sustained is a yellow flag; over 100 ms sustained is a guaranteed user-visible problem. - CPU usage — process-level, not system-level, so a single-threaded Node process pegged at 100% of one core shows as 100% even on a 16-core box.
- Memory usage — split into RSS, heap total, heap used, and external, matching what
process.memoryUsage()returns. - Active handles — the count of things libuv is tracking: sockets, timers, file descriptors, child processes.
The clever part is the correlation. Doctor does not just show you four graphs. It decides, for the duration of the run, which pattern of the four best matches a known pathology. If event loop delay is high and CPU is high, that points at a synchronous CPU hotspot. If event loop delay is high but CPU is low, that points at I/O blocking — something like a synchronous file read, a DNS resolution stall, or a native addon holding the thread. If handles climb monotonically while throughput stays flat, you are leaking sockets.
Installing and running it against a real workload
Doctor ships as a separate package inside the clinic monorepo. As of clinic 13.x (published through 2025 and into 2026) you install the orchestrator plus the tool:
“`bash
npm install -g clinic
npm install -g autocannon
“`
autocannon is not strictly required but you almost always want it, because Doctor’s output is only meaningful if the process is actually under load during the sample window. Running Doctor against an idle server produces a flat, uninteresting report.
To profile an Express API that listens on port 3000, the canonical invocation is:
“`bash
clinic doctor –on-port ‘autocannon -c 100 -d 20 localhost:$PORT’ — node server.js
“`
The --on-port flag tells Doctor to wait until the child process opens a listening port, then run the command inside the quotes against that port. -c 100 -d 20 sends 100 concurrent connections for 20 seconds. When the load generator finishes, clinic sends SIGINT to the server, flushes its sample buffer, and opens an HTML report in your browser. The report lands in ./.clinic/<pid>.clinic-doctor.html so you can archive it or diff across runs.
If your service does not bind a port — a worker consuming from a queue, for example — use the simpler form and trigger load externally:
“`bash
clinic doctor — node worker.js
“`
Then kill the worker with Ctrl+C when you have enough samples. Doctor does not care how load arrives, only that it arrives.
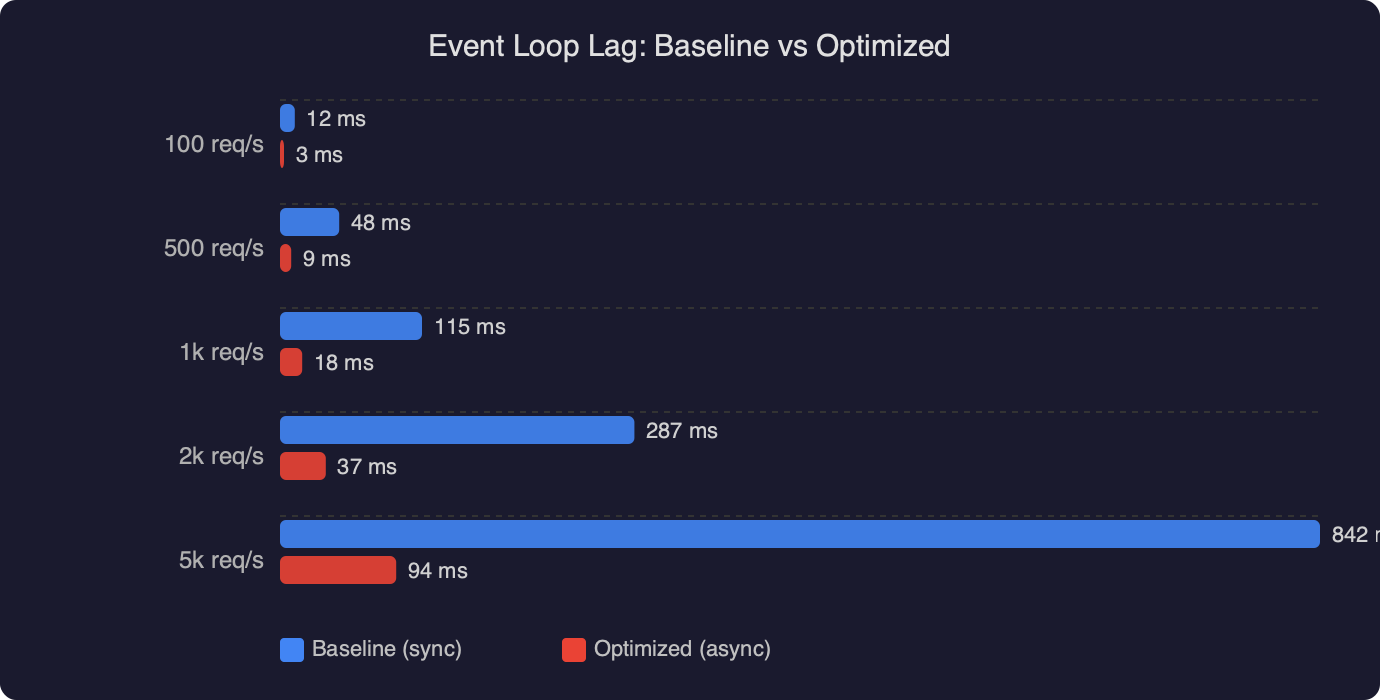
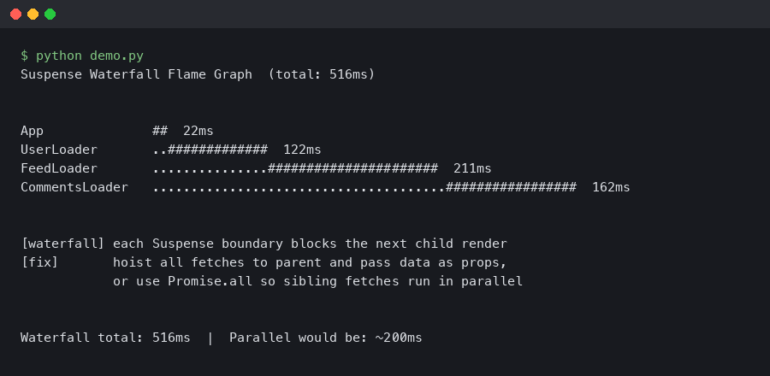
The chart above compares event loop delay in a baseline Express handler against the same handler after fixing one specific problem: a crypto.pbkdf2Sync call on the request path. Baseline p99 event loop delay sits near 180 ms during the autocannon run — you can see the sustained plateau while the load generator holds 100 concurrent connections. After switching to the async crypto.pbkdf2 and letting libuv’s thread pool handle the work, the same trace drops to a p99 under 8 ms. That is roughly a 22x improvement and it is exactly the kind of delta Doctor is designed to surface: the CPU graph barely moved because the work itself did not get cheaper, it just stopped blocking the main thread.
Reading the Doctor verdict
At the top of every Doctor report there is a colored banner with a one-line diagnosis. This is the decision tree’s verdict and it is the first thing you should read. The five possible verdicts are:
- No issue detected. Your bottleneck is elsewhere — probably a downstream service or the load generator itself. Re-run with more aggressive load before you celebrate.
- Potential I/O issue. Event loop delay is high, CPU is low. Look for
fs.readFileSync, synchronous DNS lookups viadns.lookupwithout caching, and native modules that block. - Potential event loop issue. Event loop delay is high, CPU is high, and the CPU burn correlates with the delay. This is a synchronous hotspot on the main thread. Move to clinic Flame next to get a flamegraph of where the cycles go.
- Potential garbage collection issue. Heap usage shows a classic sawtooth with GC pauses aligning to event loop delay spikes. The fix is usually allocation pressure, not leak hunting — reuse buffers, avoid per-request object churn in hot paths.
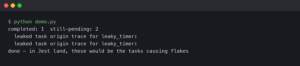
- Potential handle issue. Active handles grow without bound. You are leaking sockets, timers, or file descriptors.
The verdict is intentionally conservative. Doctor prints “potential” because it cannot run your code, only observe it. Treat the banner as a hypothesis that tells you which of clinic’s deeper tools to reach for next: clinic flame for CPU hotspots, clinic bubbleprof for async operation trees, clinic heapprofiler for allocation sources.
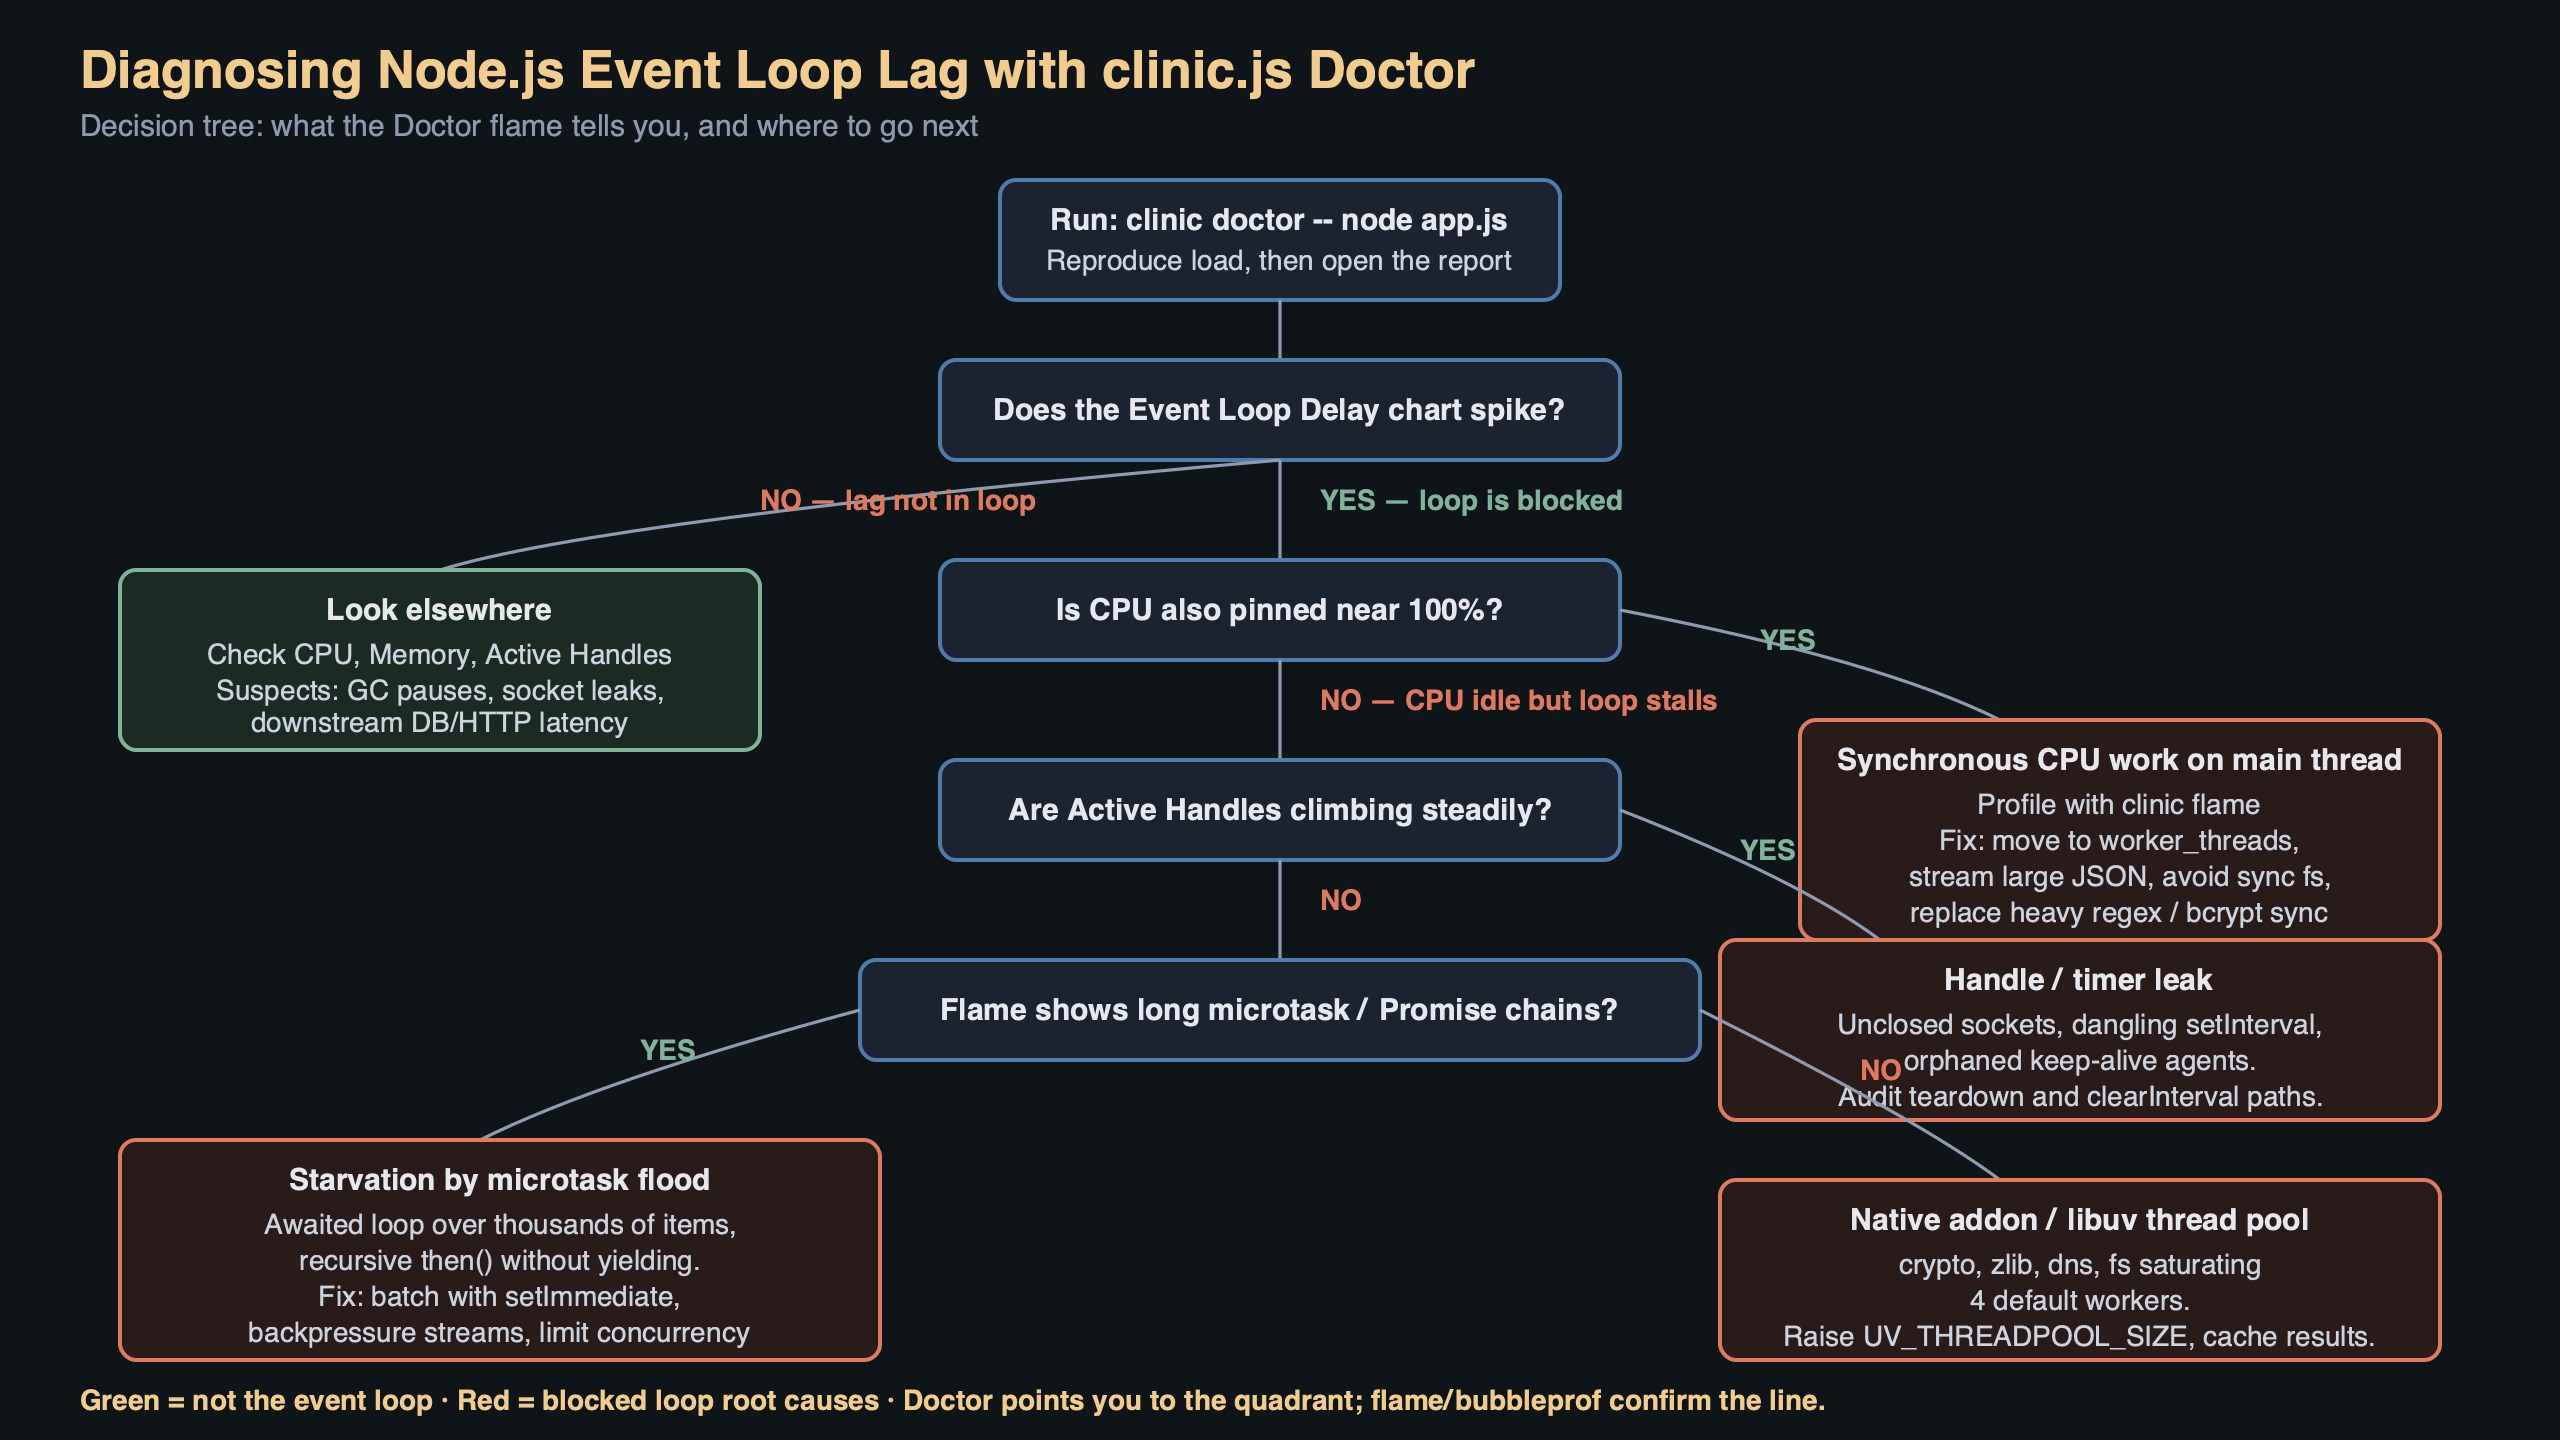
The screenshot above shows the official clinic Doctor documentation page with the four-panel layout visible: event loop delay in the top-left, CPU in the top-right, memory underneath, and active handles at the bottom. The highlighted section is the heuristic banner, which in this capture reads “Detected a potential event loop issue” with the orange warning color. Notice the documentation explicitly calls out the interpretation rule: when the event loop delay panel shows spikes that line up in time with CPU spikes, the remediation is a flamegraph via clinic flame, not a memory profile.
Common patterns and how to fix them
Four patterns account for the majority of real-world event loop lag in Node.js services. Knowing them lets you read a Doctor report in about thirty seconds.
1. Synchronous JSON parsing of large bodies
express.json() with no limit option will happily parse a 100 MB request body on the main thread. JSON.parse is synchronous and native — V8 will block the event loop for the full duration. Doctor shows this as a single sharp spike in event loop delay that perfectly matches a spike in CPU. The fix is a hard size limit and, for legitimately large payloads, a streaming parser like stream-json.
2. Synchronous crypto and compression
Any *Sync function in the crypto, zlib, or fs modules blocks the main thread. The async versions hand work off to libuv’s thread pool (default size 4, controlled by UV_THREADPOOL_SIZE) and let the event loop keep spinning. A single bcrypt.hashSync on a login endpoint will tank p99 for every other request in flight.
“`javascript
// Blocks event loop for ~80ms per call
const hash = bcrypt.hashSync(password, 12);
// Offloads to thread pool, event loop stays responsive
const hash = await bcrypt.hash(password, 12);
“`
3. Regular expression catastrophic backtracking
A poorly written regex on user input can burn seconds of CPU on a single request. V8’s regex engine is synchronous. Doctor shows this as erratic, correlated spikes in event loop delay and CPU that do not align with request volume — they align with specific request payloads. Tools like safe-regex or Node’s --disable-proto=delete combined with the node:util timer helpers help track these down, and Node 20 introduced the experimental --regexp-interpret-all flag to reduce worst-case exposure.
4. Chained array operations on large datasets
arr.map(...).filter(...).reduce(...) on a million-element array does three full passes with per-element allocation. Doctor flags this as combined event-loop and GC pressure. The fix is a single for loop or a generator-based pipeline that avoids intermediate arrays.
Production caveats worth knowing
Doctor is a development and staging tool. Do not run clinic doctor against a production process — the instrumentation overhead is meaningful, the generated report files are large, and the SIGINT-then-flush pattern is incompatible with graceful shutdown in orchestrated environments. For production event loop monitoring, use perf_hooks.monitorEventLoopDelay, which is built into Node core since 11.10.0 and has essentially zero overhead:
“`javascript
const { monitorEventLoopDelay } = require(‘perf_hooks’);
const h = monitorEventLoopDelay({ resolution: 20 });
h.enable();
setInterval(() => {
console.log(‘p99 event loop delay:’, h.percentile(99) / 1e6, ‘ms’);
h.reset();
}, 10000);
“`
Wire that into your metrics pipeline — Prometheus, Datadog, whatever you use — and alert when p99 crosses 50 ms sustained. When the alert fires, reproduce the load in staging and reach for Doctor to identify which bucket the problem lives in.
Another caveat: Doctor’s sample resolution is 10 ms. Event loop delays shorter than that get aggregated away. If you are chasing sub-millisecond jitter — rare, but some trading and real-time systems care — you need monitorEventLoopDelay with resolution: 1 or lower, not clinic.
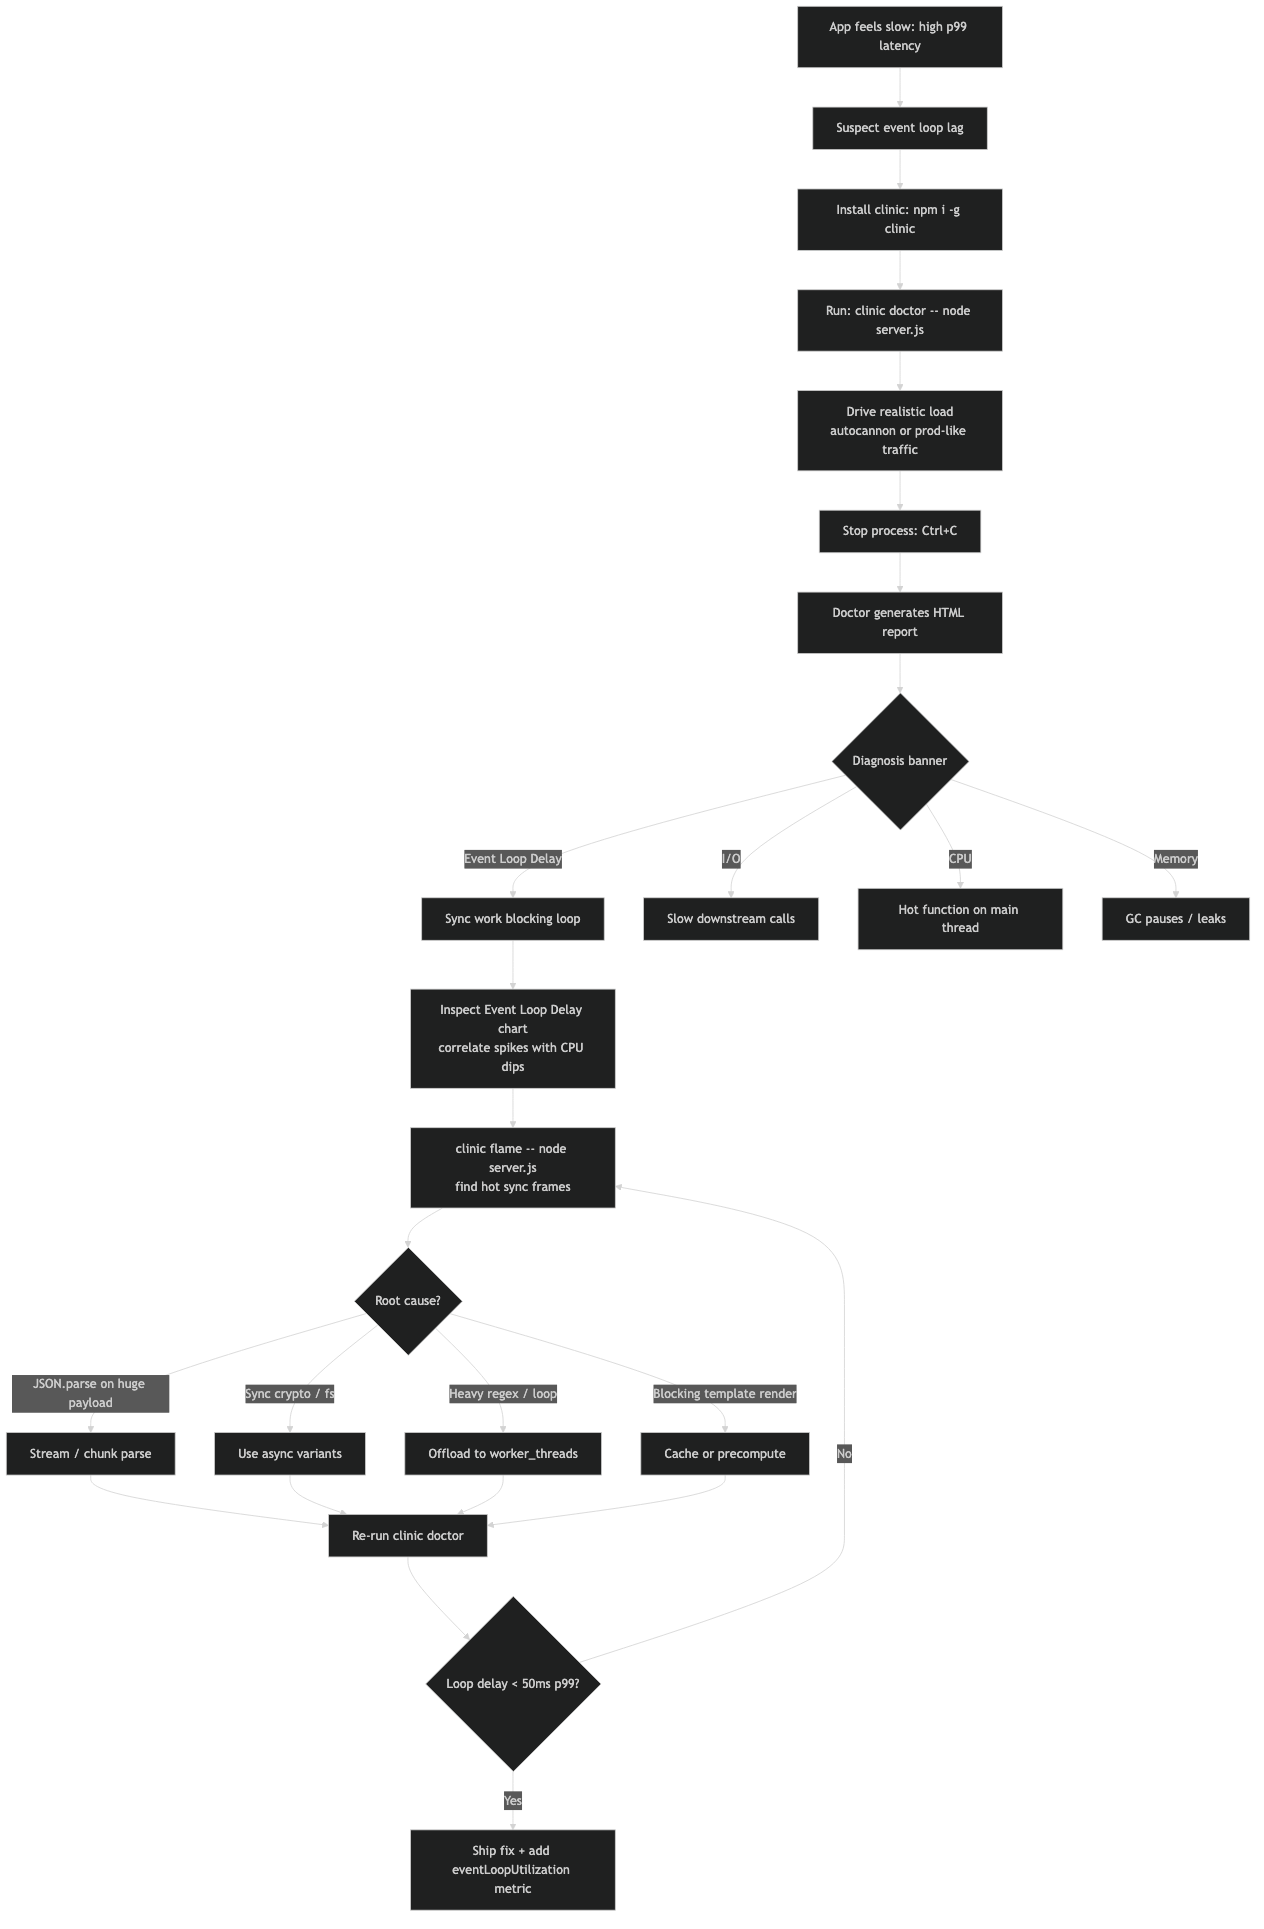
The diagram above traces a request through a Node.js process with the event loop in the center. Request enters via the HTTP parser, hits the Express middleware chain, dispatches to a handler, and that handler makes three decisions: await a database query (non-blocking, returns to the event loop), compute a hash (blocking if sync, non-blocking if async via thread pool), serialize the response (synchronous, always blocks for the duration of the serialize). The arrows on the blocking paths are red; the async handoffs to libuv are green. This is the mental model Doctor is verifying against your real code — when the red arrows dominate the timing, event loop delay climbs, and when they are short and infrequent, the loop stays fast regardless of throughput.
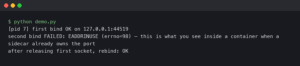
Running Doctor inside a container
The one friction point most teams hit is running clinic inside Docker. Doctor writes to ./.clinic in the current working directory and expects to open the resulting HTML in a browser. In a container neither of those things works cleanly. The pattern that works is a two-stage run:
“`bash
docker run –rm -v $PWD/clinic-out:/app/.clinic \
-p 3000:3000 my-api:latest \
clinic doctor –on-port ‘autocannon -c 50 -d 30 localhost:$PORT’ \
— node server.js
“`
Mount a volume at /app/.clinic, let the container write the report there, and open the HTML from your host machine after the run finishes. Skip the browser auto-open with --no-open if it is throwing errors about missing xdg-open. For Kubernetes, use kubectl cp to pull the generated report out of the pod after you have reproduced the issue.
The thirty-second workflow
When event loop lag is suspected, the fastest path from alert to root cause is: reproduce the load in staging with autocannon, wrap the service in clinic doctor --on-port, read the banner verdict, then jump to clinic flame if the verdict says CPU-bound or clinic bubbleprof if it says I/O-bound. Do not start with a flamegraph — a flamegraph of an I/O-bound process is a wall of epoll_wait that tells you nothing. Let Doctor triage first, then use the deeper tool the verdict points at. That split is the whole design philosophy of the clinic suite, and it is why reaching for Doctor first will save you an hour of staring at visualizations that answer the wrong question.
Common questions
How do I diagnose Node.js event loop lag with clinic.js Doctor?
Install clinic and autocannon globally, then run `clinic doctor –on-port ‘autocannon -c 100 -d 20 localhost:$PORT’ — node server.js`. Doctor wraps your process, samples event loop delay, CPU, memory, and active handles from V8 and libuv during the load, then opens an HTML report at ./.clinic/
What does clinic Doctor actually measure during a Node.js profiling run?
Doctor samples four signals at fixed intervals: event loop delay (the gap between a scheduled setImmediate and when it runs), process-level CPU usage, memory broken into RSS/heap total/heap used/external, and active handles tracked by libuv such as sockets, timers, and file descriptors. It then correlates these signals against a decision tree rather than producing a flamegraph.
What does ‘potential I/O issue’ mean in a clinic Doctor report?
It means event loop delay is high while CPU stays low, indicating something is blocking the main thread without burning cycles. Typical culprits are fs.readFileSync calls, synchronous DNS lookups via dns.lookup without caching, or native modules that block. It is distinct from an event loop issue, where both event loop delay and CPU are high and correlate together.
Why does bcrypt.hashSync destroy p99 latency on a Node.js login endpoint?
Any *Sync function in crypto, zlib, or fs blocks the main thread for its full duration — a single bcrypt.hashSync call takes around 80ms and freezes the event loop for every other in-flight request. The async equivalents hand work to libuv’s thread pool (default size 4, tunable via UV_THREADPOOL_SIZE), letting the event loop keep spinning while the work runs off-thread.
References
- clinicjs/node-clinic-doctor on GitHub — source repository for the Doctor subcommand, including the heuristic rules that produce the colored verdict banner referenced throughout this guide.
- clinic.js Doctor documentation — official NearForm documentation describing the four-panel report layout and the interpretation of each signal.
- Node.js perf_hooks.monitorEventLoopDelay API — the core API recommended for production event loop monitoring instead of clinic Doctor.
- clinicjs/node-clinic orchestrator repository — the top-level clinic package that coordinates Doctor, Flame, Bubbleprof, and Heap Profiler subcommands.
- Node.js official guide to the event loop — background on the libuv phases whose delays Doctor measures.
- autocannon load generator on GitHub — the HTTP benchmarking tool used to drive traffic through the process during a Doctor run.