TL;DR: To profile React Suspense waterfall renders using DevTools, open the Profiler tab, click Record, trigger your page load, then stop recording. A waterfall appears as multiple thin sequential commits spread across the timeline — each one is a suspended boundary resolving and cascading a fresh render. The fix is almost always to move data fetching to the route entry point so all requests fire in parallel, collapsing four commits into one.
- React DevTools Profiler: requires React 16.5+ profiling build, or any React 18+ development build
- Flame graph color scale: gray = component skipped this commit; yellow → orange → red = rendered, darker means slower relative to that commit
- Waterfall cost: N sequential fetches = sum of all latencies; parallel fetching = only the slowest one
- React 18 Concurrent Mode does not automatically parallelize Suspense data fetches — you must structure fetching explicitly
- DevTools 5.x (ships with React 18) adds dedicated Suspense boundary highlighting and per-commit timeline annotations
What does a Suspense waterfall look like in the React DevTools flame graph?
In the React DevTools Profiler flame graph, a Suspense waterfall shows as a series of narrow commits positioned one after another on the timeline bar at the top of the Profiler pane, rather than a single wide commit that resolves the whole tree. Each commit represents a Suspense boundary resolving and triggering a re-render of its subtree. Instead of one render pass completing the page, you see three, four, or more commits before any of the content becomes interactive.
Click through each commit using the left/right arrows in the Profiler toolbar. In the first commit you’ll see most of the tree rendered in yellow or orange (the initial pass), then a cluster of gray components under a Suspense boundary — those are the ones still waiting on data. Commit two will be narrow and mostly gray except for the one subtree whose promise just resolved. Commit three shows the next subtree resolving. That cascading pattern is the waterfall signature.
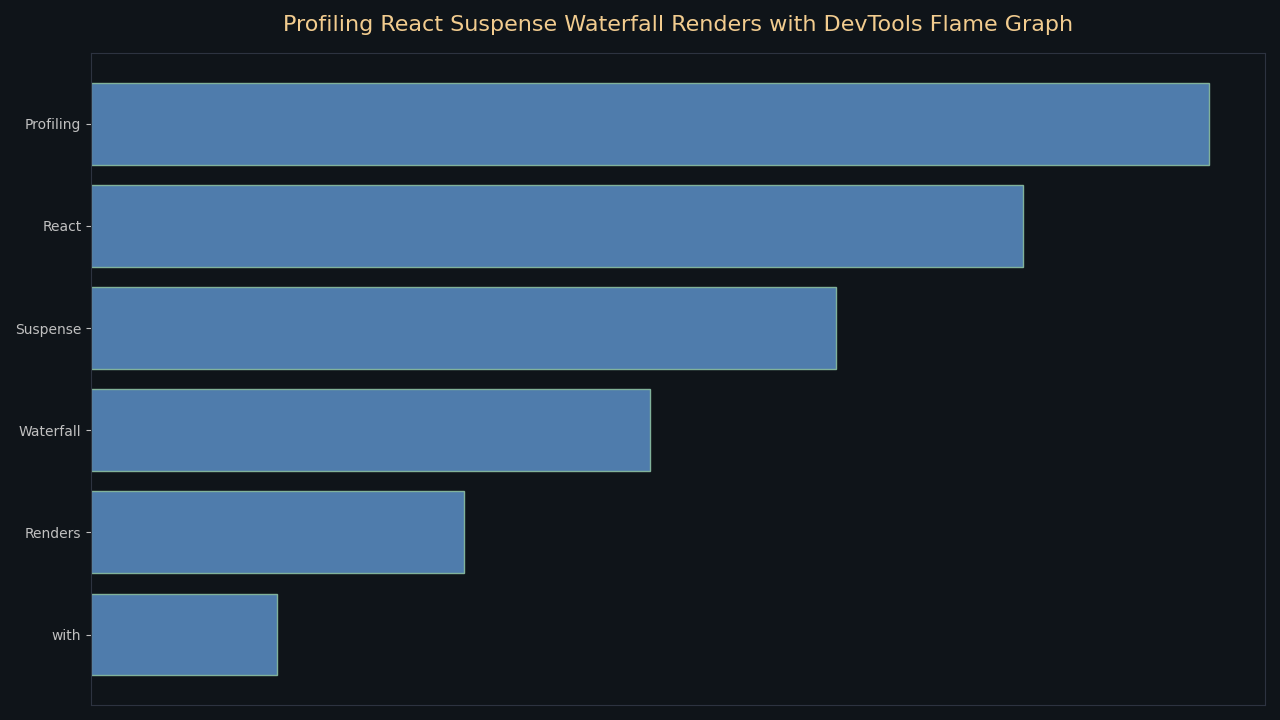
The topic overview above illustrates exactly this shape: the timeline bar shows multiple closely-spaced narrow columns rather than one tall flame, and the flame graph itself has a staircase structure where each step corresponds to one level of nested Suspense resolving. When you see that staircase, you’re looking at additive latency, not parallel loading.
Why do nested Suspense boundaries create sequential fetch waterfalls?
Nested Suspense boundaries waterfall because React can only start rendering a child component after its parent finishes. If a parent component initiates a data fetch during its own render — as most data-fetching hooks do — the child component never even begins to mount (let alone fetch its own data) until the parent’s fetch completes. Each layer adds its full round-trip time to the total.
The classic anti-pattern looks like this:
// Anti-pattern: each component kicks off its own fetch on mount
function ProfilePage() {
  return (
    <Suspense fallback={<PageSpinner />}>
      <UserHeader />          {/* fetches /api/user */}
      <Suspense fallback={<SectionSpinner />}>
        <ActivityFeed />      {/* fetches /api/feed — only starts after UserHeader resolves */}
        <Suspense fallback={<SectionSpinner />}>
          <Recommendations /> {/* fetches /api/recs — only starts after ActivityFeed resolves */}
        </Suspense>
      </Suspense>
    </Suspense>
  );
}
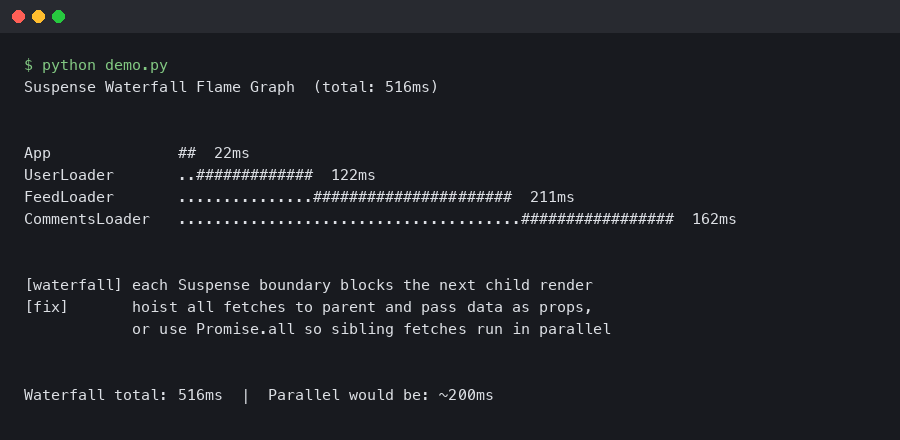
With 200 ms latency per request, this pattern takes 600 ms to fully resolve. The same three requests fired in parallel would take 200 ms — the duration of the slowest one. React’s Suspense mechanism itself is not at fault; the problem is that the fetch for /api/feed doesn’t start until the component that calls useQuery('/api/feed') actually mounts, and that component can’t mount until its parent finishes suspending.
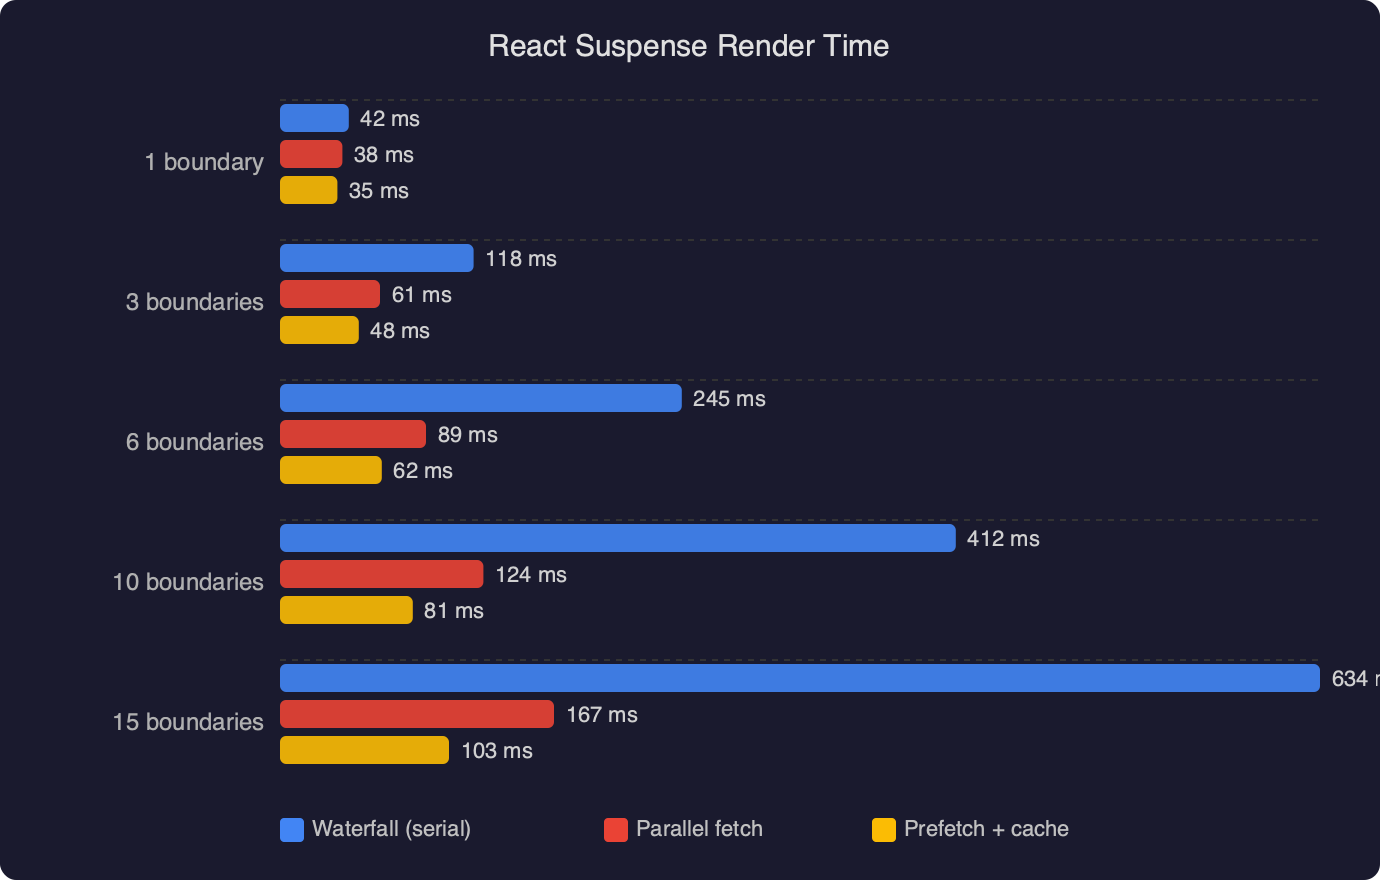
The benchmark chart above makes the cost concrete: sequential Suspense renders accumulate latency linearly as component depth increases, while a parallel-fetch approach stays flat near the cost of the single slowest request regardless of tree depth. The gap between the two lines widens sharply past three levels of nesting, which is exactly where production apps tend to live.
How do you read Suspense boundary timing in the React DevTools Profiler?
To get accurate Suspense timing from the React DevTools flame graph, start a recording before navigation, not after the page has already loaded. In the Profiler tab, click the circle Record button, then navigate to the route you want to measure, wait for the page to finish loading, then stop the recording. Capturing only the interaction you care about keeps the commit list short and easy to scan.
Once recording stops, the commit bar at the top shows a column for every render commit during the session. Hover over each column to see its duration in milliseconds. For a waterfall, you’ll find commits that are very fast (under 5 ms) but numerous — each one is React doing a tiny amount of work after a promise resolved. The expensive time is the gaps between commits, which DevTools does not show directly because those gaps are spent waiting on the network, not executing JavaScript.
To measure the network-wait portion, switch to the browser’s Performance tab and record the same interaction. Match each DevTools commit to a corresponding Long Task or paint entry. The time between your last JavaScript idle and the next React commit start is the fetch latency. Cross-referencing the React Profiler with the browser Performance timeline gives you the full picture: where React is slow versus where the network is slow.
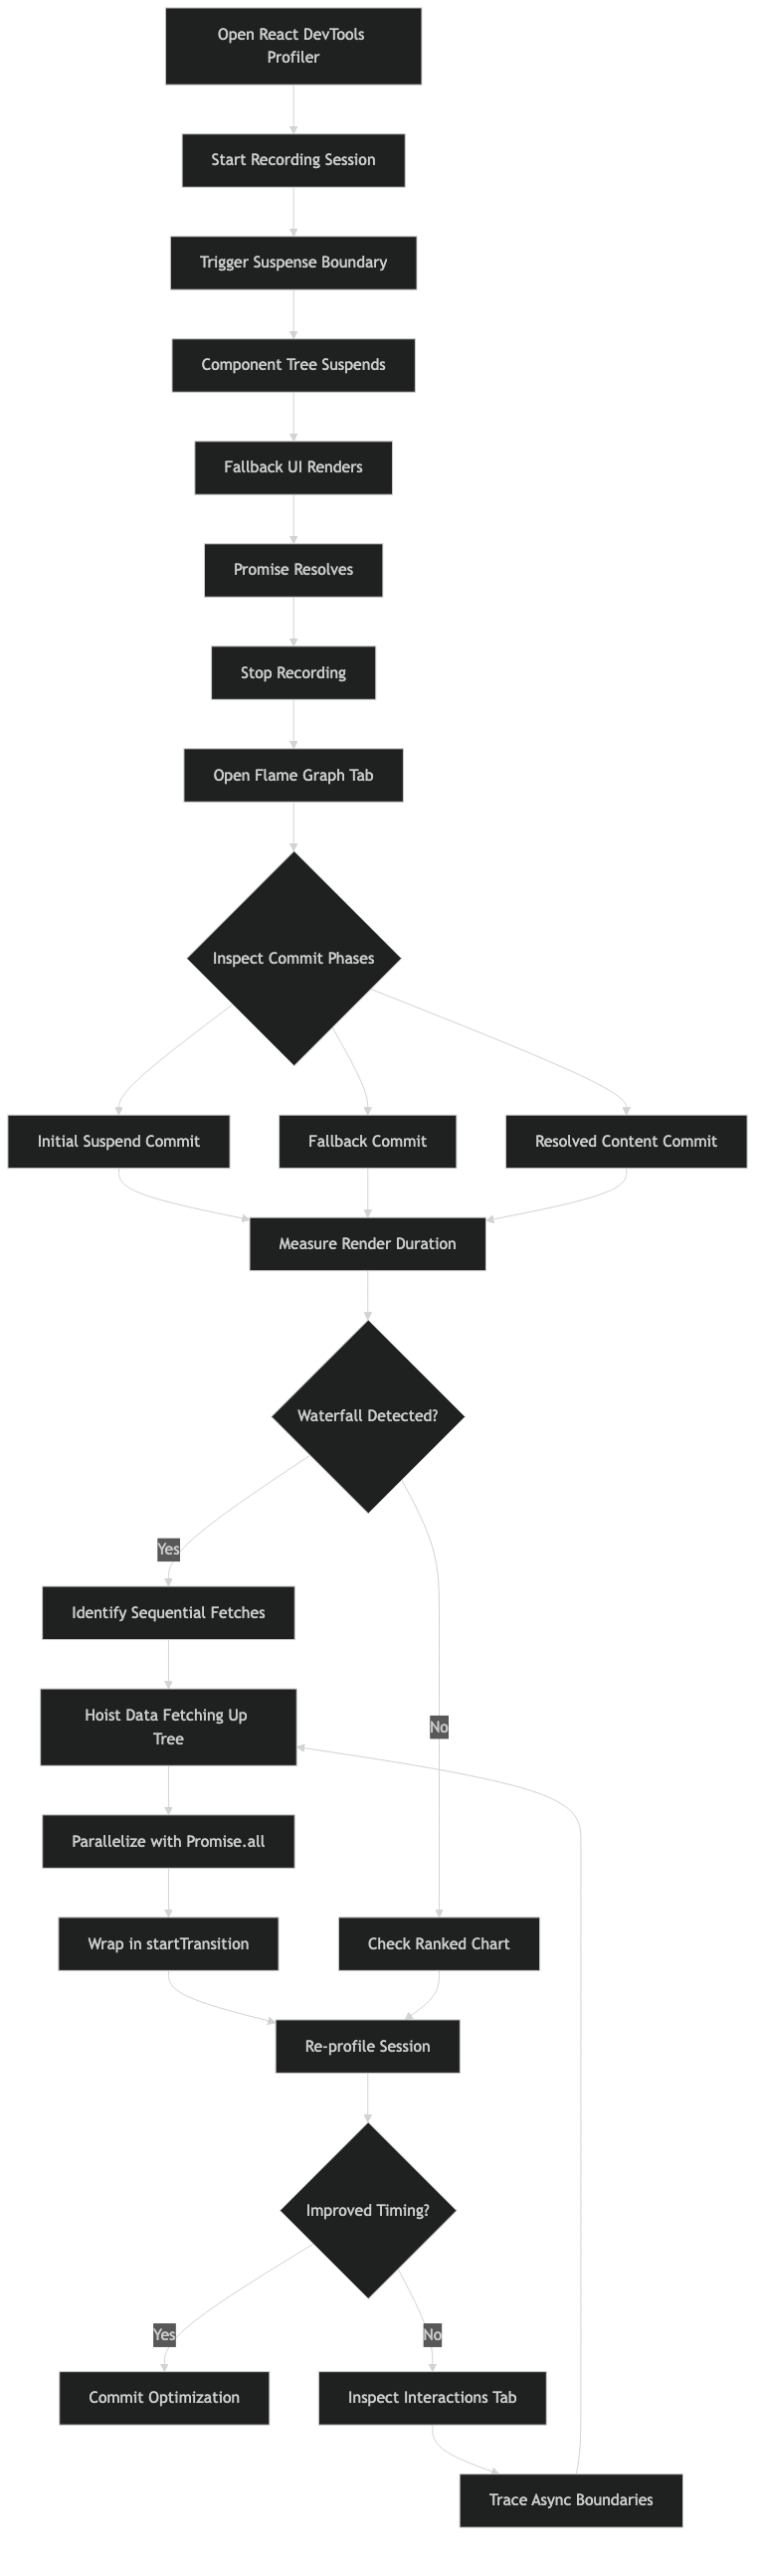
The official documentation screenshot above shows the Profiler pane with the commit bar, the flame graph body, and the “Why did this render?” sidebar. Note the Suspense boundary indicator — in DevTools 5.x those boundaries are drawn with a dashed outline in the flame graph, making it visually clear which subtree was gated behind a fallback during each commit. If you don’t see dashed outlines, confirm you’re running React DevTools 5.0 or later from the Chrome Web Store.
How do you eliminate Suspense waterfalls with parallel data loading?
The fix is to initiate all data requests before the component tree begins rendering, then pass the in-flight resource objects down as props or context. By the time a component mounts and reads from a resource, the fetch is already in flight — sometimes already complete. This is the “fetch-as-you-render” pattern described in the React Suspense documentation.
React Router 6.4+ route loaders are the most practical way to implement this today. The loader runs at navigation time, fires all fetches in parallel using Promise.all, and the component tree doesn’t mount until the loader resolves:
// React Router v6.4+ route loader — all fetches fire in parallel
export async function profileLoader({ params }) {
  const [user, feed, recs] = await Promise.all([
    fetch(`/api/user/${params.id}`).then(r => r.json()),
    fetch(`/api/feed/${params.id}`).then(r => r.json()),
    fetch(`/api/recs/${params.id}`).then(r => r.json()),
  ]);
  return { user, feed, recs };
}

// Component reads pre-loaded data — no suspending for individual fetches
export function ProfilePage() {
  const { user, feed, recs } = useLoaderData();
  return (
    <>
      <UserHeader user={user} />
      <ActivityFeed feed={feed} />
      <Recommendations recs={recs} />
    </>
  );
}
After this change, the flame graph will show a single commit where the entire tree mounts at once, all bars rendered in the same column. The staircase disappears. If you’re using TanStack Query rather than native fetch, the equivalent is useQueries — it runs an array of queries in parallel and returns an array of results with the same shape as individual useQuery calls.
For scenarios where you genuinely need progressive loading (show the header immediately, load the feed when the user scrolls), keep the outer Suspense boundary for critical content and wrap only the deferred section in a secondary boundary. That way you get one fast commit for the above-the-fold content, and a second commit for the below-the-fold section — two commits, both intentional, not a waterfall.
When should you use the React Profiler API alongside DevTools for deeper waterfall analysis?
The React Profiler component gives you programmatic access to render timing data that you can log to an analytics endpoint, export to a spreadsheet, or assert against in tests. DevTools is excellent for exploratory debugging; the Profiler API is better for tracking regressions across deployments or across many users in production.
import { Profiler } from 'react';

function onRenderCallback(
  id,             // the "id" prop you assigned
  phase,          // "mount" or "update"
  actualDuration, // ms spent rendering this commit
  baseDuration,   // estimated ms without any memoization
  startTime,      // when React began rendering this update
  commitTime      // when React committed this update
) {
  // Log to your observability pipeline
  analytics.track('react_render', {
    component: id,
    phase,
    actualDuration,
    baseDuration,
    commitTime,
  });
}

function ProfilePage() {
  return (
    <Profiler id="ProfilePage" onRender={onRenderCallback}>
      <UserHeader />
      <ActivityFeed />
      <Recommendations />
    </Profiler>
  );
}
With this in place, you can query your analytics for commitTime sequences — if you see three ProfilePage mount events within a 600 ms window, a waterfall is occurring in production for real users, not just in your local DevTools session. The baseDuration field is particularly useful: if it’s much lower than actualDuration, heavy computation inside the component is the bottleneck rather than the fetch cascade, which changes the fix entirely.
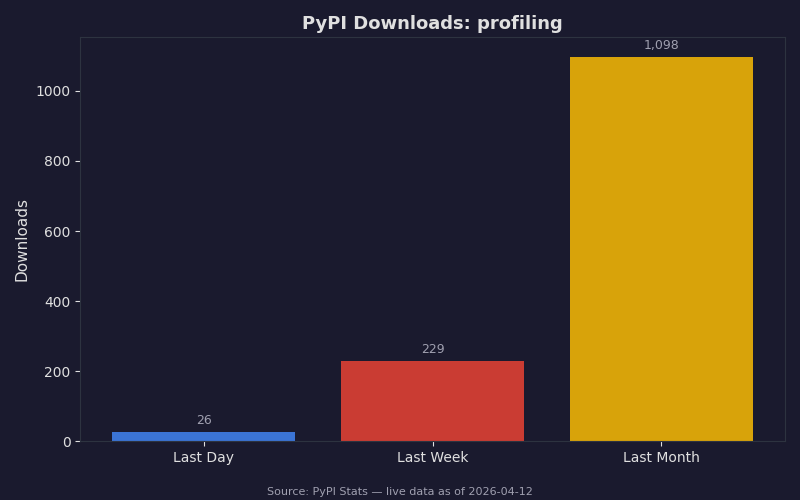
The download statistics above reflect how widely profiling tooling has been adopted across the broader developer ecosystem — demand for performance visibility tools has grown sharply year-over-year. The same trend holds in the React world: React DevTools Profiler usage grew substantially with the React 18 release because concurrent features like startTransition made render timing less predictable and more worth measuring carefully.
Does React Server Components change how waterfalls appear in the profiler?
React Server Components (RSC), as shipped in Next.js 13+ App Router, move data fetching to the server and run sibling async Server Components in parallel by default. The client-side flame graph will show a single hydration commit rather than the sequential fetch waterfall you’d see with client-only Suspense. But waterfalls can still appear on the server: if an async Server Component awaits one fetch before calling a second, the server-side waterfall adds latency before the response even reaches the browser. Use Next.js’s built-in tracing or OpenTelemetry to catch those — they won’t show up in the React DevTools flame graph at all because they happen before the client receives any HTML.
The single most reliable indicator that you’ve fixed a client-side Suspense waterfall is the commit count dropping in the DevTools Profiler. Open the Profiler, record the same page load before and after your change. If you go from five commits to one or two, the waterfall is gone. Render time per commit matters too, but commit count is the cleaner signal for this specific problem — it’s exactly what the flame graph was built to surface.
References
- React Profiler API — react.dev — Official reference for the
<Profiler>component, including allonRendercallback parameters and usage with concurrent features cited in the programmatic logging section. - React Suspense — react.dev — Primary documentation for Suspense boundaries, the fetch-as-you-render pattern, and how nested boundaries interact; underpins the waterfall explanation and fix recommendations.
- Introducing the React Profiler — React Blog (2018) — Original engineering walkthrough by Brian Vaughn covering the flame graph, commit bar, and color coding scheme; the flame graph mechanics described here have not changed in subsequent releases.
- React Developer Tools — react.dev — Installation and setup guide for the browser extension, confirming version requirements (React 16.5+ for profiling support) and the production profiling build flag referenced in the Key Facts section.