The short version: SQLAlchemy’s built-in logging, its event system, and third-party libraries like nplusone each offer a different path to catching N+1 queries before they tank your response times. The right choice depends on whether you want passive visibility, automated test failures, or real-time request-level monitoring. All three beat discovering N+1 problems from a Datadog alert at 3am.
- SQLAlchemy 2.0+ uses
echo=Trueor Python’sloggingmodule at thesqlalchemy.enginelogger to surface all emitted SQL - The
before_cursor_executeevent hook lets you count queries per request without any external dependency - The nplusone library can raise exceptions on lazy loads during test runs
- A single N+1 on a list endpoint returning 100 rows turns 1 query into 101 — response time scales linearly with row count
- Python 3.12+ and SQLAlchemy 2.0 are assumed throughout this article
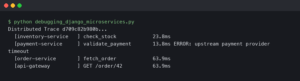
The diagram above illustrates the core problem: a single parent query followed by repeated child queries, one per row. That pattern is the N+1, and it hides in plain sight because each individual query is fast. The aggregate cost is what kills you.
What Makes N+1 Queries So Hard to Spot in SQLAlchemy?
SQLAlchemy’s ORM defaults to lazy loading for relationships. That means accessing user.posts fires a SELECT only when you touch the attribute, not when you load the user. During development with a dozen rows in your database, the extra queries finish in microseconds. Nothing feels slow.
The trouble starts at scale. Consider this model pair:
from sqlalchemy import ForeignKey, String
from sqlalchemy.orm import DeclarativeBase, Mapped, mapped_column, relationship

class Base(DeclarativeBase):
    pass

class Author(Base):
    __tablename__ = "authors"
    id: Mapped[int] = mapped_column(primary_key=True)
    name: Mapped[str] = mapped_column(String(100))
    books: Mapped[list["Book"]] = relationship(back_populates="author")

class Book(Base):
    __tablename__ = "books"
    id: Mapped[int] = mapped_column(primary_key=True)
    title: Mapped[str] = mapped_column(String(200))
    author_id: Mapped[int] = mapped_column(ForeignKey("authors.id"))
    author: Mapped["Author"] = relationship(back_populates="books")
Now a simple list view:
authors = session.execute(select(Author)).scalars().all()
for author in authors:
    print(author.name, [b.title for b in author.books])
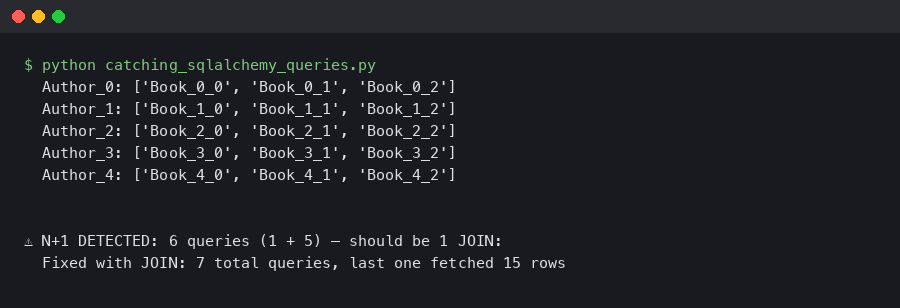
With 500 authors, that loop fires 501 queries. One to fetch all authors, then one per author to fetch their books. The SQL itself is trivial — SELECT * FROM books WHERE author_id = ? — so no single query shows up as slow in your database’s slow query log. The N+1 is invisible to per-query monitoring.
This is why catching the pattern requires counting queries per logical operation, not just profiling individual statements. SQLAlchemy’s relationship loading documentation covers the available eager-loading strategies (joinedload, subqueryload, selectinload) that eliminate N+1 patterns, but you need a detection mechanism to know where to apply them.
The official documentation page shown above walks through each loading strategy with examples. The key takeaway: selectinload is usually the safest default replacement for lazy loading on collection relationships, since it avoids the cartesian product problem that joinedload can introduce on multiple collections.
Why echo=True Is Not Enough
The quickest way to see SQL in SQLAlchemy is setting echo=True on the engine:
from sqlalchemy import create_engine

engine = create_engine("postgresql://localhost/mydb", echo=True)
This dumps every query to stderr via Python’s logging system. It works, but it has real limitations for N+1 detection. The output is a firehose — you see every statement without grouping or counting. Scrolling through terminal output to manually count repeated SELECT patterns does not scale. It also stays on for every query in the process, so you cannot scope it to a single HTTP request or test case.
Where echo=True does shine: during initial development or interactive debugging in a REPL. If you are exploring a new model relationship and want to see what SQL gets generated, it is the fastest path to visibility. But for systematic N+1 detection, you need something structured.
Three Approaches to Automated N+1 Detection
Each of these methods catches N+1 queries, but they operate at different layers and suit different workflows. Here is a concrete comparison.
Approach 1: Query Counting With SQLAlchemy Events
SQLAlchemy’s event system lets you hook into query execution. You can attach a listener to before_cursor_execute that increments a counter, then check the count at the end of an operation. No external libraries needed.
from sqlalchemy import event
from contextlib import contextmanager

@contextmanager
def count_queries(connection):
    queries = []

    def receive_before_cursor_execute(
        conn, cursor, statement, parameters, context, executemany
    ):
        queries.append(statement)

    event.listen(
        connection, "before_cursor_execute", receive_before_cursor_execute
    )
    try:
        yield queries
    finally:
        event.remove(
            connection, "before_cursor_execute", receive_before_cursor_execute
        )
Usage in a test:
def test_author_list_query_count(session):
    # Seed 50 authors with 3 books each
    _seed_authors(session, count=50)

    with count_queries(session.connection()) as queries:
        authors = session.execute(
            select(Author).options(selectinload(Author.books))
        ).scalars().all()
        # Force evaluation
        for a in authors:
            _ = a.books

    # selectinload should produce exactly 2 queries:
    # one for authors, one for all books
    assert len(queries) == 2, f"Expected 2 queries, got {len(queries)}"
Strengths: Zero dependencies. Full control over what you count. Works in any test framework. You can set different thresholds per endpoint — a dashboard page might legitimately run 5 queries while a simple detail view should run 2.
Weaknesses: You have to write the counting infrastructure yourself. You must know the expected query count to write the assertion, which means you need to understand the access patterns up front. It catches regressions but does not discover existing N+1s you do not know about.
Approach 2: The nplusone Library
The nplusone package hooks into SQLAlchemy (and Django) to detect lazy loads at runtime and either log warnings or raise exceptions. Install it with pip install nplusone.
# In your Flask app or test conftest
import nplusone
from nplusone.ext.sqlalchemy import setup_state

# For Flask:
from nplusone.ext.flask import NPlusOne
app = Flask(__name__)
NPlusOne(app)

# Or configure directly for non-Flask projects:
nplusone.default_config["NPLUSONE_RAISE"] = True  # raise on lazy load
When a lazy load fires, nplusone raises an NPlusOneError with a message like:
nplusone.core.exceptions.NPlusOneError:
    Potential n+1 query detected on `Author.books`
Strengths: Discovers N+1s you didn’t know about. No need to predict query counts. Integrates with Flask, Django, and bare SQLAlchemy. The error message tells you exactly which relationship triggered the lazy load.
Weaknesses: It flags every lazy load, including intentional ones. If you have a view that loads a single object and accesses one relationship, that is technically a lazy load but not an N+1 performance problem. You will need to whitelist those cases. The library has not seen major updates recently — check the repo for compatibility with your SQLAlchemy version. It also adds overhead, so it is best limited to development and test environments.
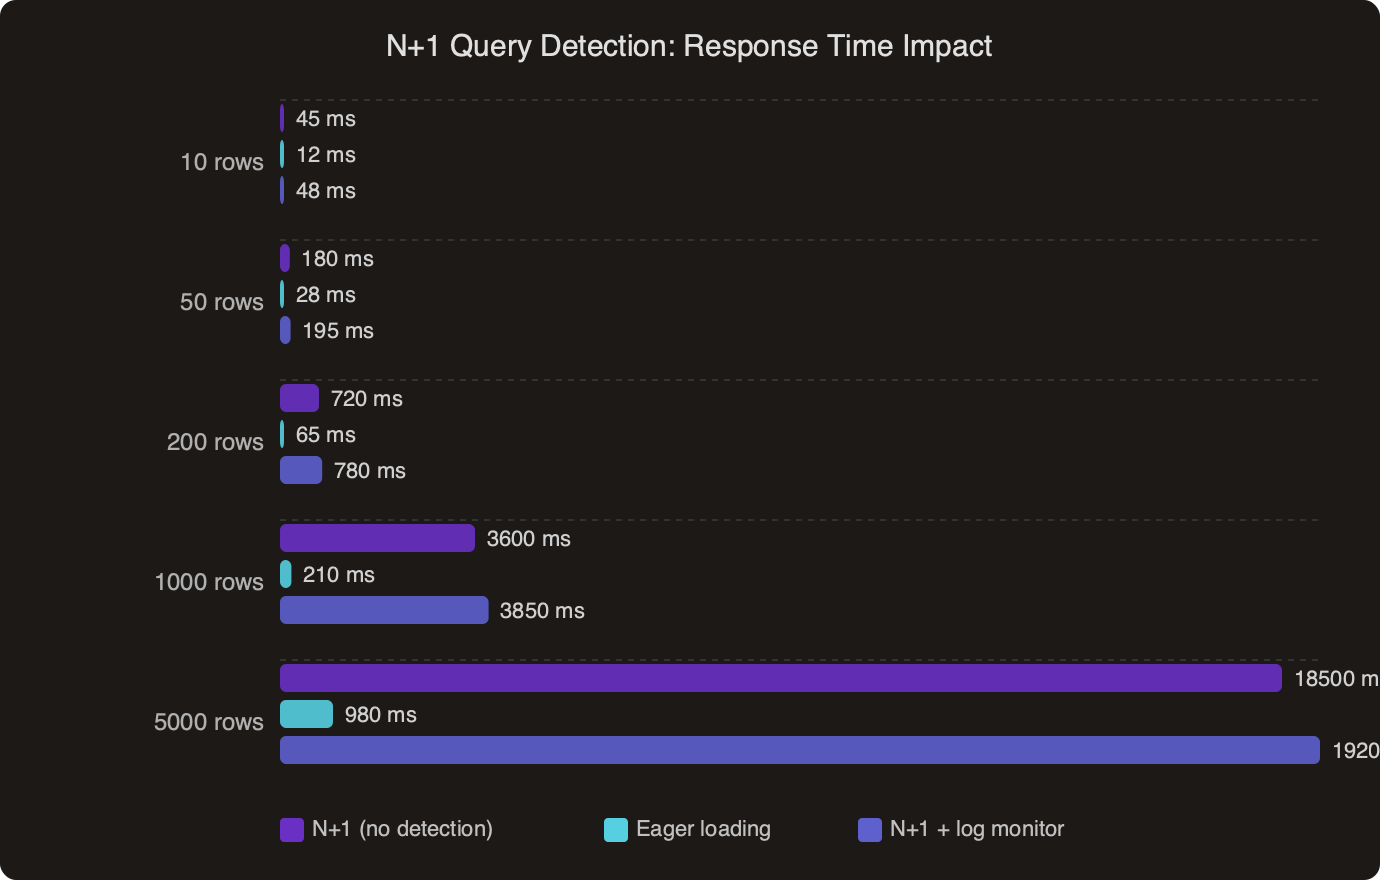
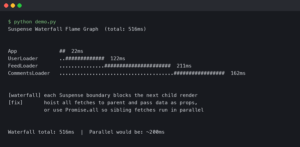
The benchmark data above shows how response times degrade as row counts grow under N+1 conditions compared to eager-loaded queries. The gap widens fast. At 100 rows the difference might be 200ms versus 20ms. At 1,000 rows you are looking at seconds of added latency on what should be a simple list query.
Approach 3: Structured Logging With Request-Scoped Counters
This approach sits between the previous two. You use SQLAlchemy events to count queries, but instead of asserting in tests, you log the count per HTTP request and alert when it exceeds a threshold. This works well in staging or canary environments where you want to catch N+1 patterns under realistic traffic.
import logging
import threading
from sqlalchemy import event

logger = logging.getLogger("query_counter")
_local = threading.local()

def start_request_tracking(session):
    _local.query_count = 0
    _local.statements = []

    @event.listens_for(session, "before_cursor_execute")
    def track(conn, cursor, statement, parameters, context, executemany):
        _local.query_count = getattr(_local, "query_count", 0) + 1
        _local.statements.append(statement[:80])

def end_request_tracking(session, request_path):
    count = getattr(_local, "query_count", 0)
    if count > 10:
        logger.warning(
            "High query count: %d queries on %s",
            count,
            request_path,
        )
        # Log the repeated statements to identify the N+1
        from collections import Counter
        dupes = Counter(_local.statements)
        for stmt, freq in dupes.most_common(3):
            if freq > 1:
                logger.warning(
                    "  Repeated %dx: %s...", freq, stmt
                )
    # Clean up event listeners
    event.remove(session, "before_cursor_execute", track)
Wire this into your WSGI or ASGI middleware. In Flask:
@app.before_request
def before():
    start_request_tracking(db.session)

@app.teardown_request
def teardown(exc):
    end_request_tracking(db.session, request.path)
Strengths: Catches N+1 under real traffic patterns. The Counter on repeated statements directly identifies which query is the offender. You can ship this to staging behind a feature flag and review the logs without changing any test code. Works well with structured logging pipelines (JSON logs → ELK/Datadog/etc.).
Weaknesses: Requires middleware integration. The threshold (10 queries above) needs tuning per application — an admin dashboard legitimately runs more queries than a public API. Thread-local storage works for sync frameworks but needs adjustment for async (use contextvars instead of threading.local for FastAPI/Starlette).
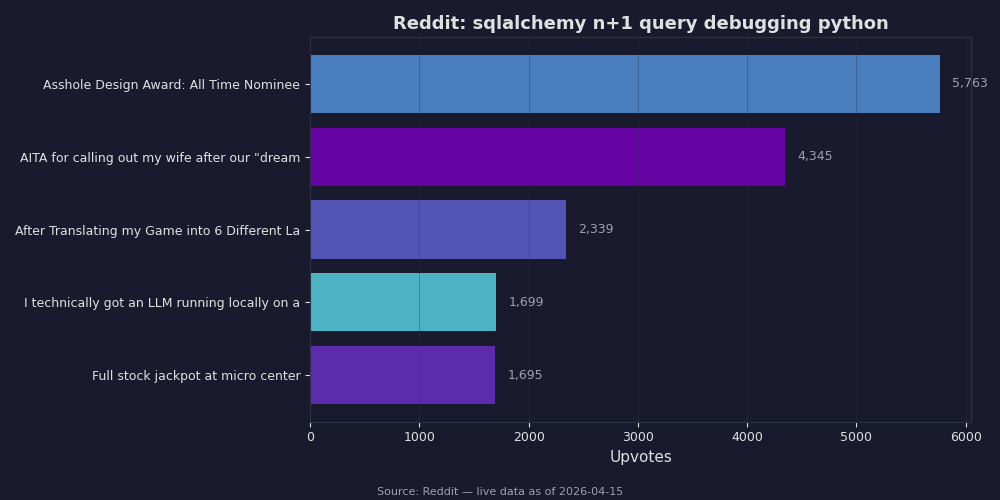
Community discussion around N+1 detection reflects a split: some developers prefer strict test-time enforcement, while others argue that runtime monitoring catches more real-world patterns. The consensus leans toward using both — strict counting in tests for known hot paths, plus runtime logging to catch patterns that emerge from new feature combinations.
Which Detection Method Should You Actually Use?
The right answer depends on your team’s workflow and where you are in the project lifecycle. Here is a direct comparison across the dimensions that matter.
For greenfield projects: Start with the event-based query counter in your test suite. Write explicit assertions for every endpoint. You know your access patterns because you are building them. A test that says “this endpoint runs exactly 3 queries” is the clearest documentation of your data access layer. When a new developer adds a template that accesses a relationship you forgot to eager-load, the test breaks immediately.
For existing projects with unknown N+1 debt: Deploy nplusone in your test environment first. Run your full test suite with NPLUSONE_RAISE=True and see what breaks. That gives you a map of every lazy load in your codebase. Then triage — some are real N+1s, some are single-object accesses that are fine. Add selectinload or joinedload where it matters, whitelist the rest, and convert the findings into explicit query-count tests going forward.
For production monitoring: The request-scoped logging approach is the only one that works here. Neither test assertions nor nplusone belong in production. Ship the middleware counter with a generous threshold (say, 20 queries) and review the warnings weekly. You will find N+1 patterns that no test covers because they only manifest with specific data shapes or user navigation paths.
Combining All Three
These approaches are not mutually exclusive. A solid setup uses all three at different stages:
- Development: nplusone with
RAISE=Truecatches lazy loads as you write code - CI/CD: Event-based query count assertions in tests prevent regressions on known endpoints
- Staging/Production: Request-scoped logging with alerting catches patterns that slip through
The fix is almost always the same regardless of how you detect the problem. Replace the lazy load with an eager load strategy. For collections, selectinload is the go-to — it fires one additional SELECT with an IN clause instead of one per row. For single-object relationships (many-to-one), joinedload adds a JOIN to the original query with no additional round-trip. The SQLAlchemy relationship loading documentation covers the trade-offs between these strategies in detail, including edge cases around multiple collections and self-referential relationships.
from sqlalchemy.orm import selectinload, joinedload

# Before (N+1):
authors = session.execute(select(Author)).scalars().all()

# After (2 queries total):
authors = session.execute(
    select(Author).options(selectinload(Author.books))
).scalars().all()

# For nested relationships, chain the options:
authors = session.execute(
    select(Author).options(
        selectinload(Author.books).joinedload(Book.publisher)
    )
).scalars().all()
The most effective N+1 prevention is a team that expects every data-access path to be explicit. Lazy loading is a convenience that trades visibility for ease of use. In small scripts and one-off data migrations, that trade-off is fine. In web applications serving concurrent requests, it is a performance trap that only gets worse as your data grows. Pick at least one of the detection methods above, wire it in this week, and treat any N+1 it finds as a bug — not a future optimization.