There are few experiences more frustrating for a developer than seeing a green checkmark on all local tests, only to push the code and watch the CI/CD pipeline fail with a cryptic error message. The infamous “but it works on my machine” is a common refrain in modern software development, and the automated, ephemeral nature of Continuous Integration and Continuous Deployment (CI/CD) environments is often the culprit. Unlike local development where you have an IDE, breakpoints, and a full suite of developer tools at your disposal, a remote CI runner is a black box that can be notoriously difficult to inspect.
This disconnect between local and CI environments turns debugging from a systematic process into a frustrating cycle of “commit, push, and pray.” However, troubleshooting a failing pipeline doesn’t have to be a guessing game. By adopting the right strategies and tools, you can demystify your CI/CD process, gain deep visibility into your builds, and fix bugs with precision and speed. This comprehensive guide will walk you through foundational and advanced techniques for CI/CD debugging, transforming your pipelines from a source of anxiety into a reliable asset for quality assurance and rapid deployment.
Why CI/CD Debugging is a Unique Challenge
Before diving into solutions, it’s crucial to understand why debugging in a CI/CD context is fundamentally different from local code debugging. The challenges stem from the core principles that make CI/CD so powerful: automation, consistency, and isolation.
The Ephemeral Environment Problem
Most modern CI/CD systems (like GitHub Actions, GitLab CI, CircleCI) execute jobs in clean, temporary environments—often Docker containers or fresh virtual machines. Once a job finishes, whether in success or failure, that environment is destroyed along with all its state, logs (unless explicitly saved), and temporary files. This ephemerality prevents you from “poking around” after a failure to diagnose the issue, a common first step in local debugging.
Limited Interactivity and the Primacy of Logs
CI jobs run non-interactively. You can’t attach a debugger, set a breakpoint, or step through code execution in real-time. Your primary window into the process is the stream of log output printed to the console. This makes high-quality, structured logging and debugging not a luxury, but an absolute necessity. An unhandled exception might produce a stack trace, but subtle issues like misconfigured environment variables or incorrect file permissions often fail silently, leaving you to piece together clues from the build script’s output.
Environment Discrepancies
The “it works on my machine” syndrome is almost always due to subtle differences between your local setup and the CI runner’s environment. These can include:
- Operating System: Developing on macOS or Windows while the CI runner uses a minimal Linux distribution.
- System Dependencies: A library like
lib-sslorbuild-essentialsis present on your machine but not in the CI Docker image. - Environment Variables: A critical
API_KEYorDATABASE_URLis set in your local.envfile but is missing or incorrect in the CI/CD secrets. - Language/Runtime Versions: Running Node.js v18 locally while the CI job defaults to v16.
Effective CI/CD debugging is about systematically identifying and eliminating these differences.
Foundational Techniques for Pipeline Troubleshooting
When a pipeline fails, start with these fundamental techniques to quickly gather information and narrow down the potential cause. These strategies focus on increasing visibility and enabling local reproduction of the error.
Enhance Log Verbosity with Shell Commands
The first step is to get more information. Most build tools, compilers, and package managers have verbosity flags (e.g., -v, --verbose). However, the most powerful tool in a shell-based CI environment is the shell itself. By adding set -ex to the beginning of your script steps, you instruct the shell to do two things:
set -e: Exit immediately if a command exits with a non-zero status. This prevents the script from continuing after an error, which can obscure the original problem.set -x: Print each command to the logs before it is executed. This shows you exactly what is running, including the values of any expanded variables.
Here’s how you would apply this in a GitHub Actions workflow:
name: CI Build and Test

on: [push]

jobs:
  build:
    runs-on: ubuntu-latest
    steps:
      - uses: actions/checkout@v3

      - name: Setup Node.js
        uses: actions/setup-node@v3
        with:
          node-version: '18'

      - name: Install Dependencies and Run Tests
        run: |
          set -ex # Enable verbose logging and exit on error
          npm ci
          echo "DATABASE_URL=${{ secrets.TEST_DATABASE_URL }}" > .env
          npm test -- --verbose
Leverage Artifacts for Deeper Inspection
When logs aren’t enough, artifacts are your best friend. CI/CD platforms allow you to save files and directories generated during a job. You can use this feature to capture detailed log files, test reports, code coverage reports, or even application binaries for later inspection. A key strategy is to configure your jobs to upload artifacts specifically on failure.
In this GitLab CI example, the test reports are always saved, but the entire logs directory is only saved if the job fails, giving you crucial diagnostic files without cluttering successful runs.
test_job:
  stage: test
  image: python:3.10
  script:
    - pip install -r requirements.txt
    - pytest --junitxml=report.xml || true # Continue even if tests fail to capture artifacts
    # A more complex script might generate custom logs
    - ./run_integration_tests.sh > logs/integration.log 2>&1
  artifacts:
    when: always
    paths:
      - report.xml
    expire_in: 1 week
  artifacts:
    when: on_failure
    paths:
      - logs/ # Save the entire logs directory on failure
    expire_in: 1 day
Reproduce Failures Locally with Docker
The most reliable way to debug a CI failure is to reproduce it in an identical environment on your local machine. Since most CI runners use Docker containers, you can pull the exact same image and run your commands inside it. This eliminates nearly all environment discrepancies.
For example, if your GitLab CI job uses the node:18-alpine image, you can start an interactive session in that container:
# Pull the same image used in your CI pipeline
docker pull node:18-alpine

# Run an interactive shell inside the container
# -v $(pwd):/app mounts your current project directory into /app inside the container
# -w /app sets the working directory to /app
docker run -it --rm -v $(pwd):/app -w /app node:18-alpine sh

# Now you are inside the container, with the same OS and runtime as the CI runner
# You can run your build and test commands manually to see the error firsthand
npm install
npm test
Once inside, you can install packages, inspect files, and run commands one by one to pinpoint the exact point of failure. This is the single most effective technique for solving complex CI/CD debugging issues.
Advanced Debugging and Automation
For particularly stubborn bugs that resist basic techniques, you may need to escalate to more powerful, interactive methods. These advanced strategies bridge the gap between the remote CI environment and your local developer tools.
Interactive Debugging via SSH
Some CI/CD platforms offer the ability to access a running or failed job via an SSH session. This gives you a live terminal inside the CI environment, allowing you to explore the filesystem, check environment variables, and run commands freely. Tools like CircleCI offer “Rerun job with SSH” functionality, and you can achieve similar results in GitHub Actions using third-party Actions like mxschmitt/action-tmate. While incredibly powerful, this approach should be used judiciously as it pauses the automated flow and often requires manual cleanup.
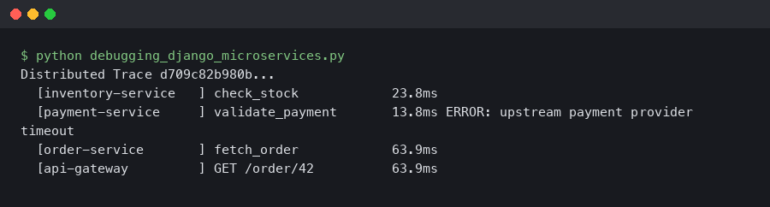
Remote Debugging for Application Code
What if the build succeeds, but your integration tests fail due to a bug in the application code itself? This is where remote debugging shines. The strategy involves starting your application (e.g., a Node.js server or a Python script) inside the CI container with a debug server enabled and a port exposed. You can then attach your local IDE’s debugger (like VS Code) to this remote process, giving you full breakpoint, stepping, and inspection capabilities as if the code were running locally.
For a Python application using Django, you can use the debugpy library. First, install it and modify your test script to start the debug server:
# In your run_ci_tests.py script
import debugpy
import os

# Listen on all interfaces (0.0.0.0) on a specific port
# This is crucial for being accessible from outside the Docker container
debugpy.listen(("0.0.0.0", 5678))

print("Waiting for debugger to attach...")
debugpy.wait_for_client()
print("Debugger attached!")

# Now, run your Django tests
from django.core.management import execute_from_command_line

os.environ.setdefault('DJANGO_SETTINGS_MODULE', 'myapp.settings')
execute_from_command_line(['manage.py', 'test'])
In your CI configuration, you would run this script instead of the standard test command and use a tool like tmate or port forwarding to expose port 5678. You could then configure your local VS Code launch.json to connect to it. This provides an unparalleled level of insight for complex application debugging within a CI context.
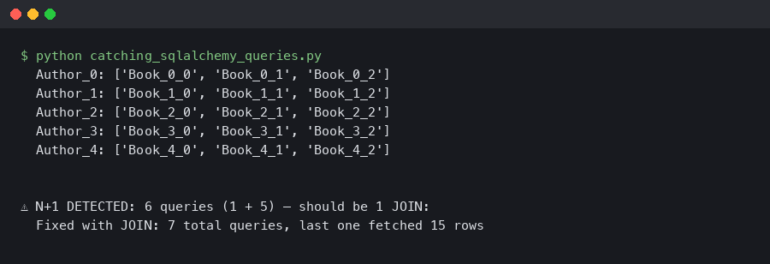
Integrating Error Tracking and Monitoring
For non-deterministic or flaky tests that fail intermittently, logs may not be enough. Integrating an error tracking service like Sentry or Bugsnag can provide invaluable assistance. By configuring your test runner to report unhandled exceptions to these services, you can capture rich, aggregated reports of failures over time. These reports often include the full stack trace, request context, system parameters, and even suspected commits, which helps in identifying patterns and solving hard-to-reproduce bugs in your testing and debugging workflow.
Best Practices for a Proactive Debugging Culture
The ultimate goal is not just to become better at reactive debugging, but to build pipelines that are inherently more transparent and less prone to failure. This involves a “shift-left” approach, catching issues earlier in the development lifecycle.
Shift-Left with Static Analysis
Incorporate static analysis tools, linters, and code formatters directly into your CI pipeline as a mandatory first step. Tools like ESLint for JavaScript/TypeScript, Pylint for Python, or SonarQube for multiple languages can catch a wide range of bugs, security vulnerabilities, and code smells before any tests are even run. A failure at the linting stage is fast, cheap, and easy to fix.
Design Fast-Failing, Granular Jobs
Avoid monolithic CI scripts that perform linting, building, unit testing, and integration testing all in one giant job. Instead, break your pipeline into smaller, independent stages or jobs. This provides faster feedback by isolating the point of failure immediately. If the unit tests fail, you know the problem is not with the Docker build or the deployment script, saving you valuable time.
Ensure Environment Parity with Infrastructure as Code
Use tools like Docker Compose, Terraform, or the AWS CDK to define your application’s entire environment—including databases, caches, and other services—as code. By using the same definitions for local development and CI, you drastically reduce the chances of environment-specific bugs. This is the ultimate solution to the “it works on my machine” problem.
Conclusion
CI/CD debugging is a critical skill in modern software engineering. It requires a shift in mindset away from the interactive, IDE-centric approach of local development towards a more systematic, evidence-based process of investigation. By mastering the fundamentals of enhanced logging and local reproduction, you can solve the vast majority of pipeline failures. For the most challenging bugs, advanced techniques like SSH access and remote debugging provide the powerful visibility you need.
Ultimately, the most effective strategy is a proactive one. By building debuggability into your pipelines through static analysis, granular jobs, and consistent environments, you can prevent bugs before they happen. Treat your CI/CD configuration as a first-class citizen of your codebase, and you will build a resilient, transparent, and efficient development process that accelerates delivery and boosts quality.