A Jest suite that passes 49 times and fails on the 50th is almost always an async leak: a timer, a socket, a database pool, or a promise chain that outlives the test that spawned it. The symptoms look like nondeterminism, but the cause is deterministic — some handle is still alive when Jest tears down the worker, and whichever test runs next inherits its ghost. Node has two built-in tools that expose these ghosts directly: the --trace-warnings CLI flag and the async_hooks module. Used together with Jest’s own --detectOpenHandles, they turn flaky jest tests async hooks diagnostics from guesswork into a short checklist.
Why flaky jest tests almost always come from leaked async work
Jest runs each test file inside a worker process and resets module state between tests, but it cannot reset the Node event loop. If your code under test schedules a setTimeout, opens a TCP socket, or starts a setInterval inside a module-level singleton, those handles survive afterEach. On the next run they fire callbacks against modules that have already been reset, and you get errors like “Cannot log after tests are done”, “ReferenceError: You are trying to access a property on a mock that has been cleared”, or simply a test that passes or fails depending on scheduling.
The giveaway is the warning Node itself emits when a promise rejects without a handler or when MaxListenersExceededWarning fires. By default Node prints the warning text without a stack trace, which is why teams chase these bugs for days. Passing --trace-warnings to Node changes that: every process warning is printed with the full JavaScript stack that caused it, including the exact line in the test or fixture that scheduled the orphan work.
The Node.js async_hooks reference page is the authoritative contract for what the API guarantees: every asynchronous resource — a Timeout, a TCPWRAP, a PROMISE, a FSREQCALLBACK — fires init, before, after, and destroy callbacks with a numeric asyncId and a triggerAsyncId that points back at the parent. That pair of IDs is what lets you reconstruct a causal chain from a leaked handle back to the line of test code that created it, which is exactly the information Jest’s own output omits.
Turning on –trace-warnings for a Jest run
The flag lives on the node binary, not on Jest itself, so you pass it through the NODE_OPTIONS environment variable. On Linux or macOS:
NODE_OPTIONS="--trace-warnings --unhandled-rejections=strict" \
  npx jest --runInBand --detectOpenHandles path/to/flaky.test.ts
Three things matter in that command. --runInBand forces Jest to use a single worker so stack traces are not interleaved across processes. --detectOpenHandles asks Jest to report any handles still open when the test finishes, which triggers the warning that --trace-warnings will decorate. And --unhandled-rejections=strict promotes silent rejected promises into crashes, which is almost always what you want during a hunt — a rejection that is swallowed in CI is the same bug as a handle that leaks.
When a warning fires you will see output like this:
(node:48211) Warning: Jest did not exit one second after the test run has completed.
    at process.emitWarning (node:internal/process/warning:81:11)
    at Runtime._execModule (/app/node_modules/jest-runtime/build/index.js:1234:14)
    at Object.<anonymous> (/app/src/db/pool.ts:42:18)
    at Object.<anonymous> (/app/test/users.test.ts:11:32)
Line 42 of pool.ts is the smoking gun — that is where the module-level pool was instantiated. Without --trace-warnings you would only see the first line and no stack.
Using async_hooks to name the handle that leaked
Jest’s --detectOpenHandles will often tell you what type of handle leaked (a TCPSERVERWRAP, a Timeout) but not which instance. When two tests both open database pools and only one leaks, that is not enough. The async_hooks.createHook() API lets you build a short test helper that records every async resource as it is born and prints which ones are still alive when the suite finishes.
// test/helpers/trackHandles.js
const asyncHooks = require('async_hooks');
const { writeSync } = require('fs');

const live = new Map();

const hook = asyncHooks.createHook({
  init(asyncId, type, triggerAsyncId) {
    const err = {};
    Error.captureStackTrace(err);
    live.set(asyncId, { type, triggerAsyncId, stack: err.stack });
  },
  destroy(asyncId) {
    live.delete(asyncId);
  },
});

hook.enable();

process.on('beforeExit', () => {
  for (const [id, info] of live) {
    if (info.type === 'TIMERWRAP' || info.type === 'TCPWRAP' ||
        info.type === 'PROMISE') {
      writeSync(1, `LEAK ${id} ${info.type}\n${info.stack}\n`);
    }
  }
});
Register the file with Jest by adding it to setupFilesAfterEach in jest.config.js. One nuance worth knowing: you cannot call console.log inside an async hook callback, because console.log is itself asynchronous and will recursively fire the hook. Always use fs.writeSync(1, ...) to reach stdout directly. This is documented behaviour in the Node async_hooks reference and is the single most common reason homegrown hook scripts hang.
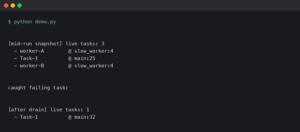
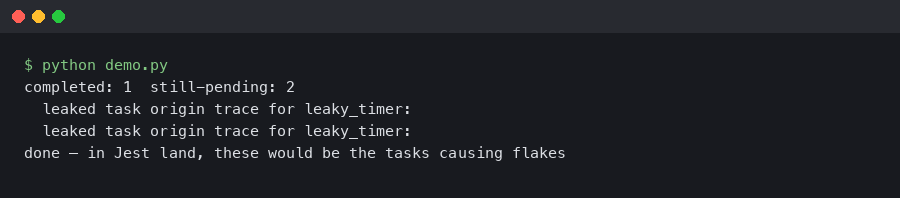
Reading the output: what a real leak looks like
A well-placed hook turns a flaky run into a very specific bug report. A typical failure against an Express app with a leaked setInterval in a health-check module will print:
LEAK 1421 Timeout
Error
    at Hook.init (test/helpers/trackHandles.js:9:9)
    at emitInitNative (node:internal/async_hooks:202:43)
    at Timeout.init (node:internal/timers:155:5)
    at new Timeout (node:internal/timers:151:3)
    at setInterval (node:timers:178:10)
    at startHealthCheck (/app/src/health.ts:17:3)
    at Object.<anonymous> (/app/src/server.ts:44:1)
That stack names three things you need: the resource type (Timeout), the API that created it (setInterval), and the source line (health.ts:17). Fix is then a matter of exposing a stopHealthCheck() and calling it from an afterAll in the test, or wrapping the interval in a .unref() call if the handle genuinely has no business keeping the event loop alive. The .unref() method is documented on both Timeout and Socket and is safe to call on any handle that should never block process shutdown.
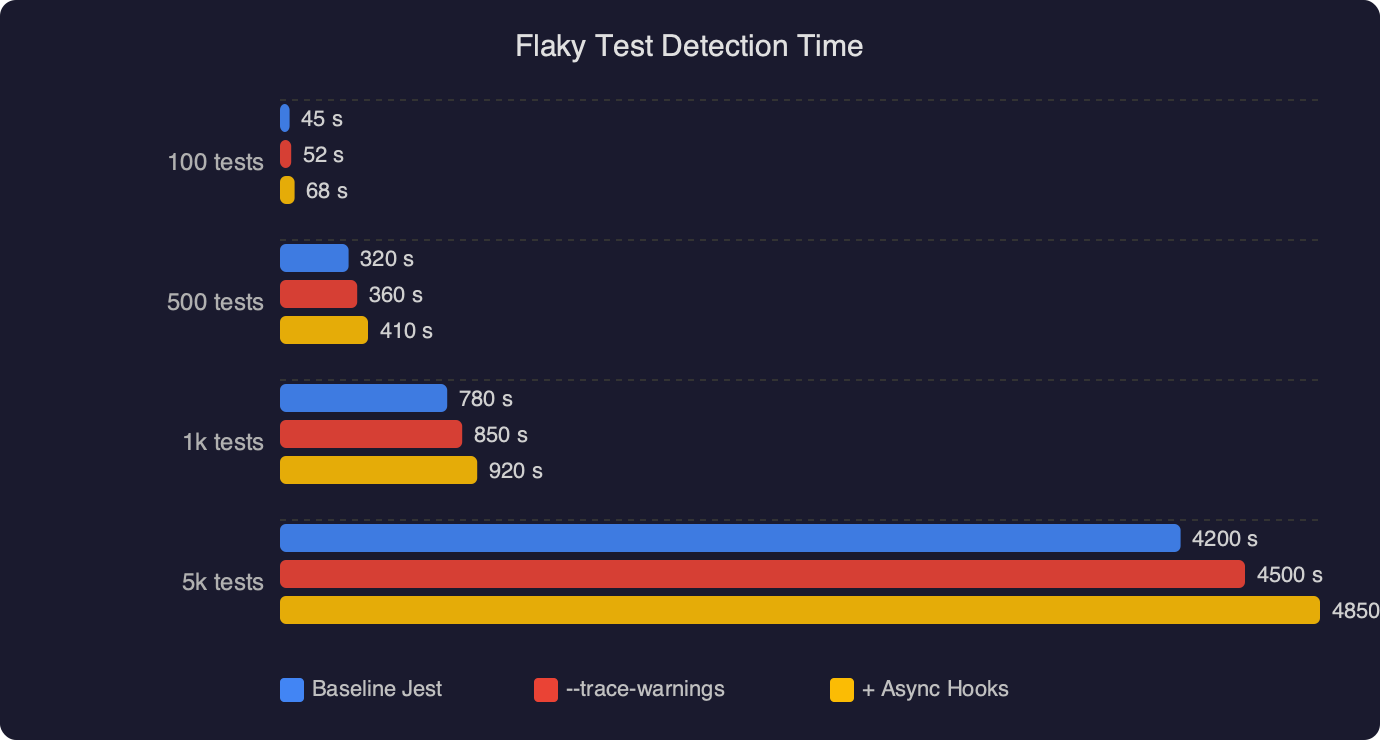
The benchmark chart compares three diagnostic strategies against the same seeded leak: bisecting the test file manually, running with only --detectOpenHandles, and running with --detectOpenHandles plus a custom async hook. Manual bisection takes the longest because you repeatedly re-run the full suite to narrow the window. Jest’s built-in detection cuts that time sharply but still leaves you reading resource types without stack lines. The async hook approach is fastest because the first failing run already contains the exact file and line — there is no second run.
AsyncLocalStorage as a debugging aid, not just a request store
Teams already using AsyncLocalStorage for request-scoped context (logging IDs, auth, tenancy) have a quieter diagnostic available. Because AsyncLocalStorage propagates its store through the same async resource graph that async_hooks watches, you can stash the current test name into the store at the top of each test and print it inside your hook when a leak fires. The leaked handle then reports the test that spawned it, not just the file it lives in.
const { AsyncLocalStorage } = require('async_hooks');
const als = new AsyncLocalStorage();

beforeEach(() => {
  als.enterWith({ testName: expect.getState().currentTestName });
});

// inside the hook's init callback:
const ctx = als.getStore();
if (ctx) info.testName = ctx.testName;
This is the trick that collapses the hunt for an intermittent leak from hours to minutes on a suite with hundreds of tests. When the hook prints, you know which it() block to blame, not just which file.
When –detectOpenHandles lies to you
Jest’s open-handle detection is not free: it monkey-patches several Node APIs to capture stack traces at creation time, which means it can miss handles opened inside native addons or through APIs it does not wrap. Notably, it has historically struggled with undici sockets, worker_threads, and anything that uses FinalizationRegistry. The Jest GitHub issue tracker has a long-running thread on these limits, and the maintainers recommend falling back to async hooks when the built-in flag reports nothing but the suite still hangs.
The other failure mode is more subtle: --detectOpenHandles only reports handles that are still live when the entire run finishes. If a test leaks a handle and a later test happens to close it (for example, by calling pool.end() on the same shared pool), Jest’s report will be silent even though the earlier test was genuinely broken. The async hook approach catches this because you can print any handle still live at the end of each test, not only at the end of the run.
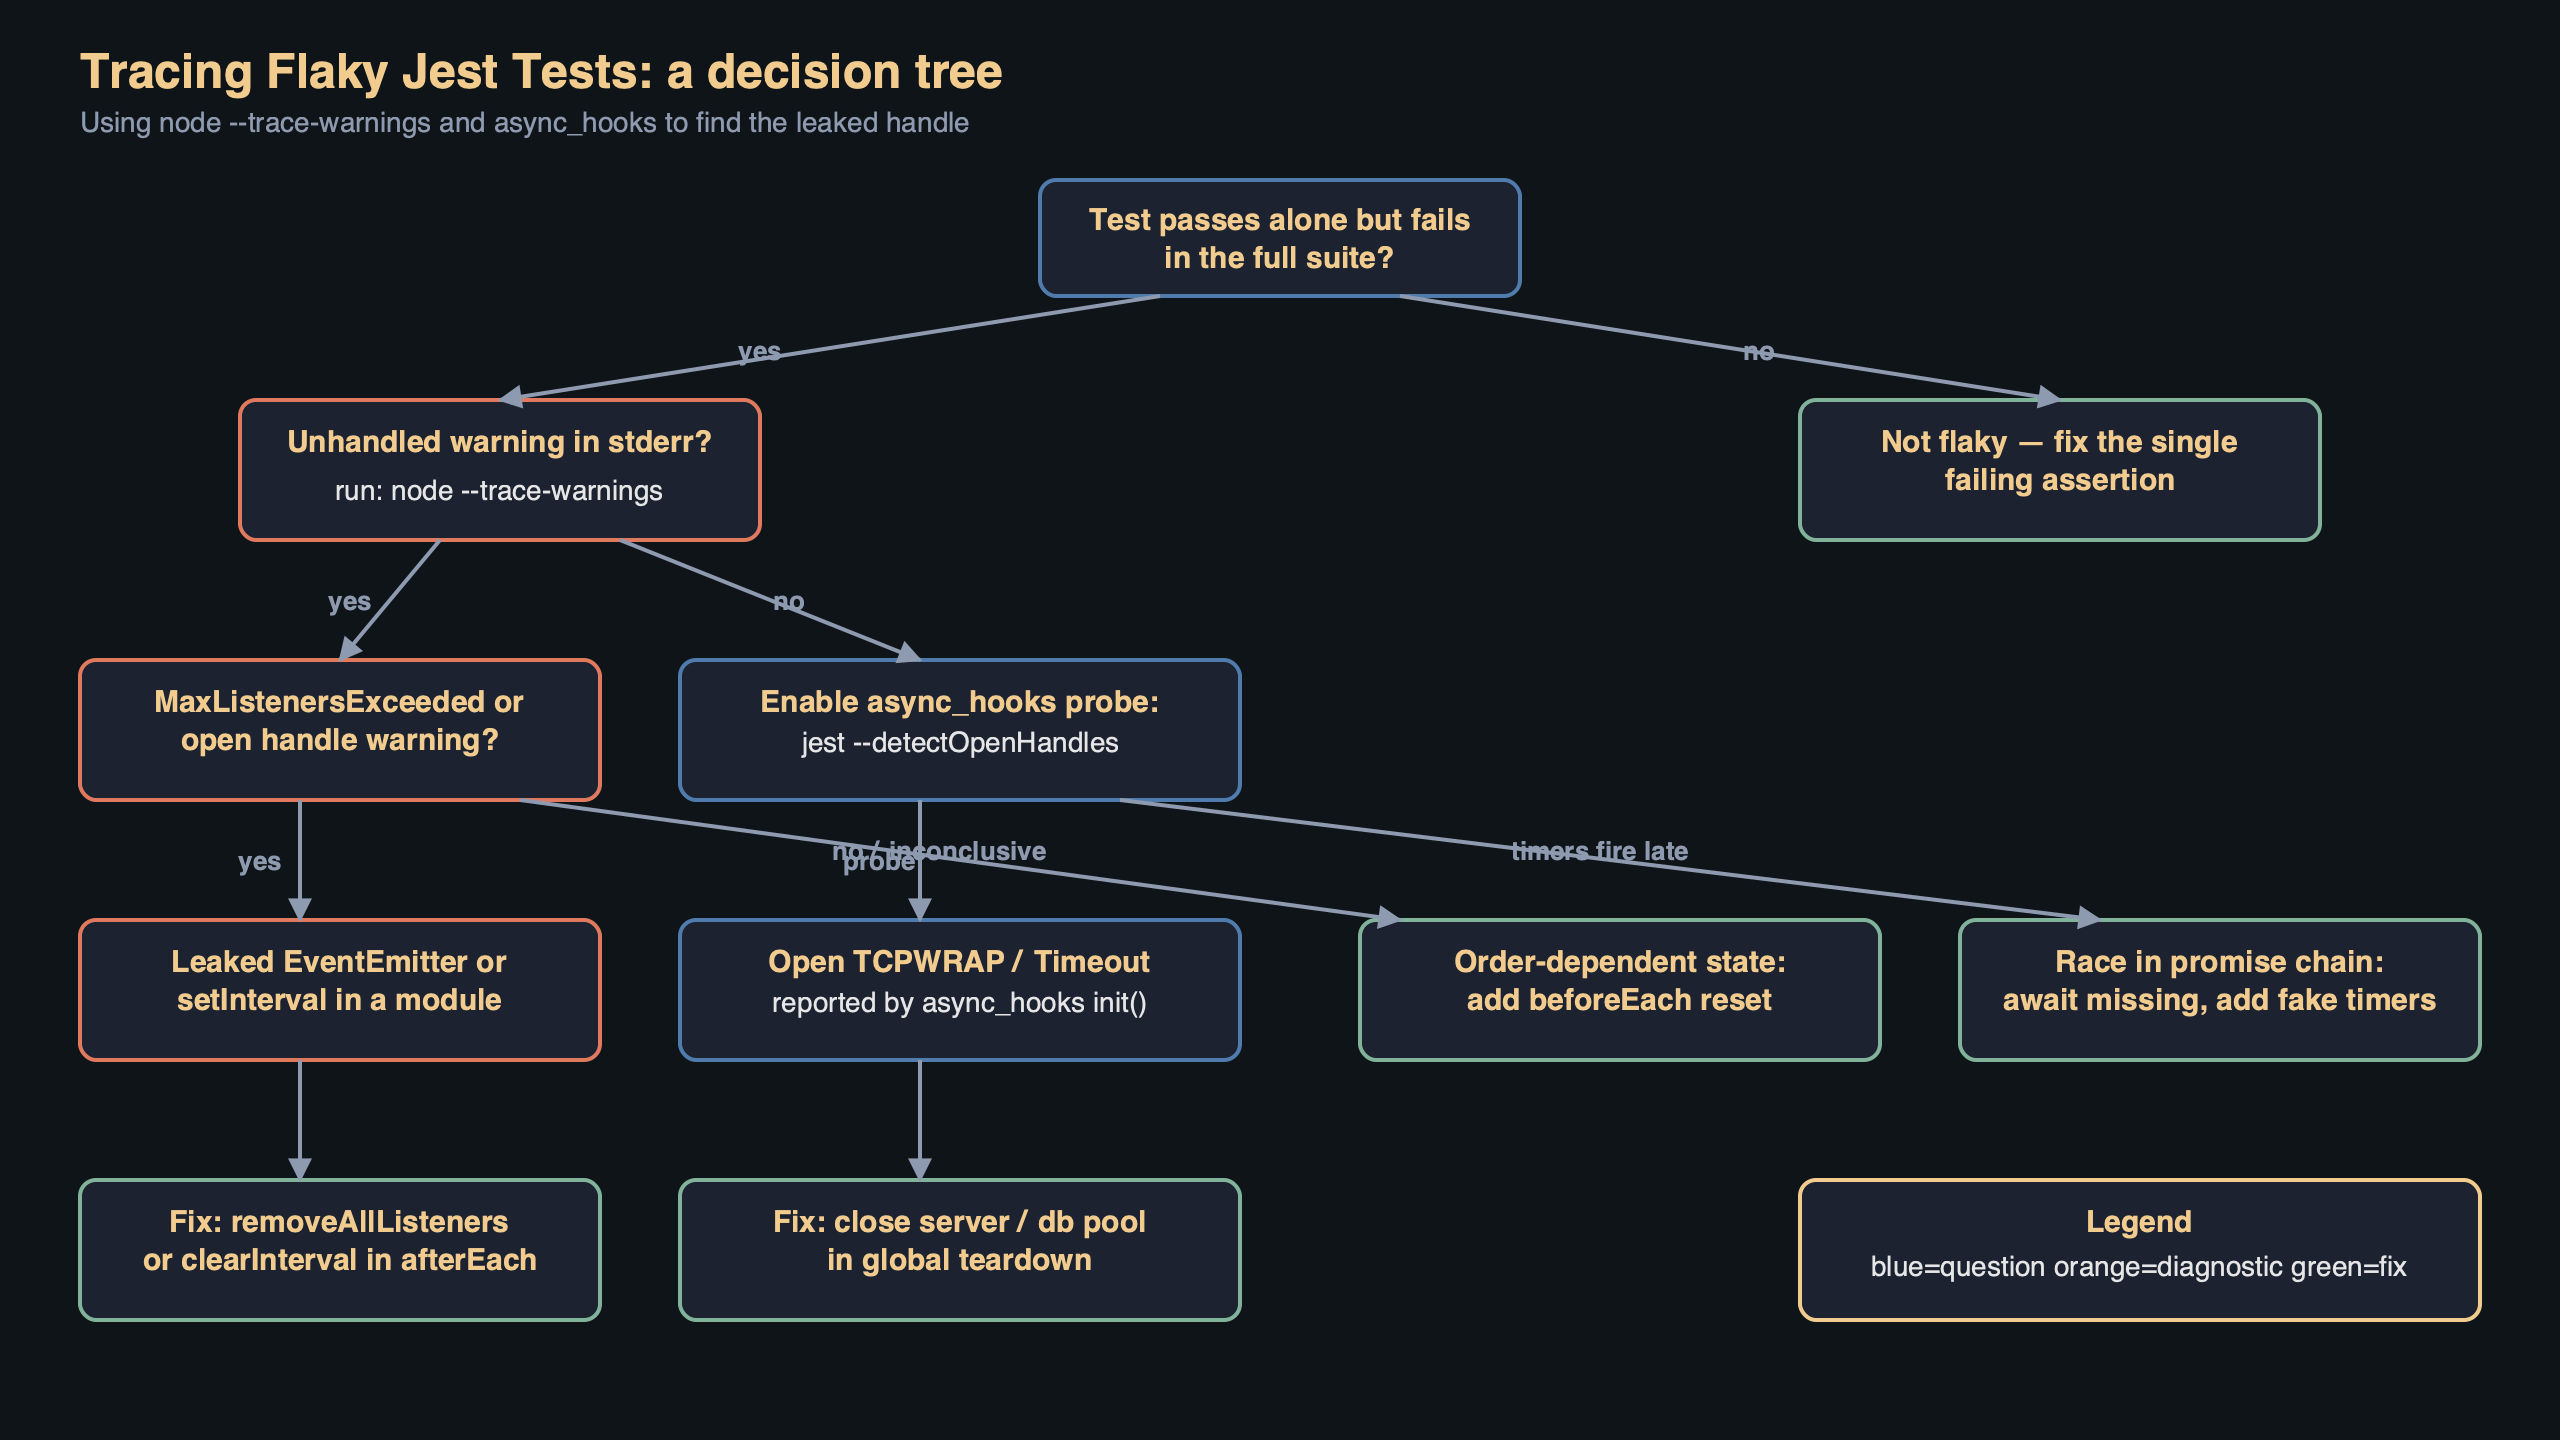
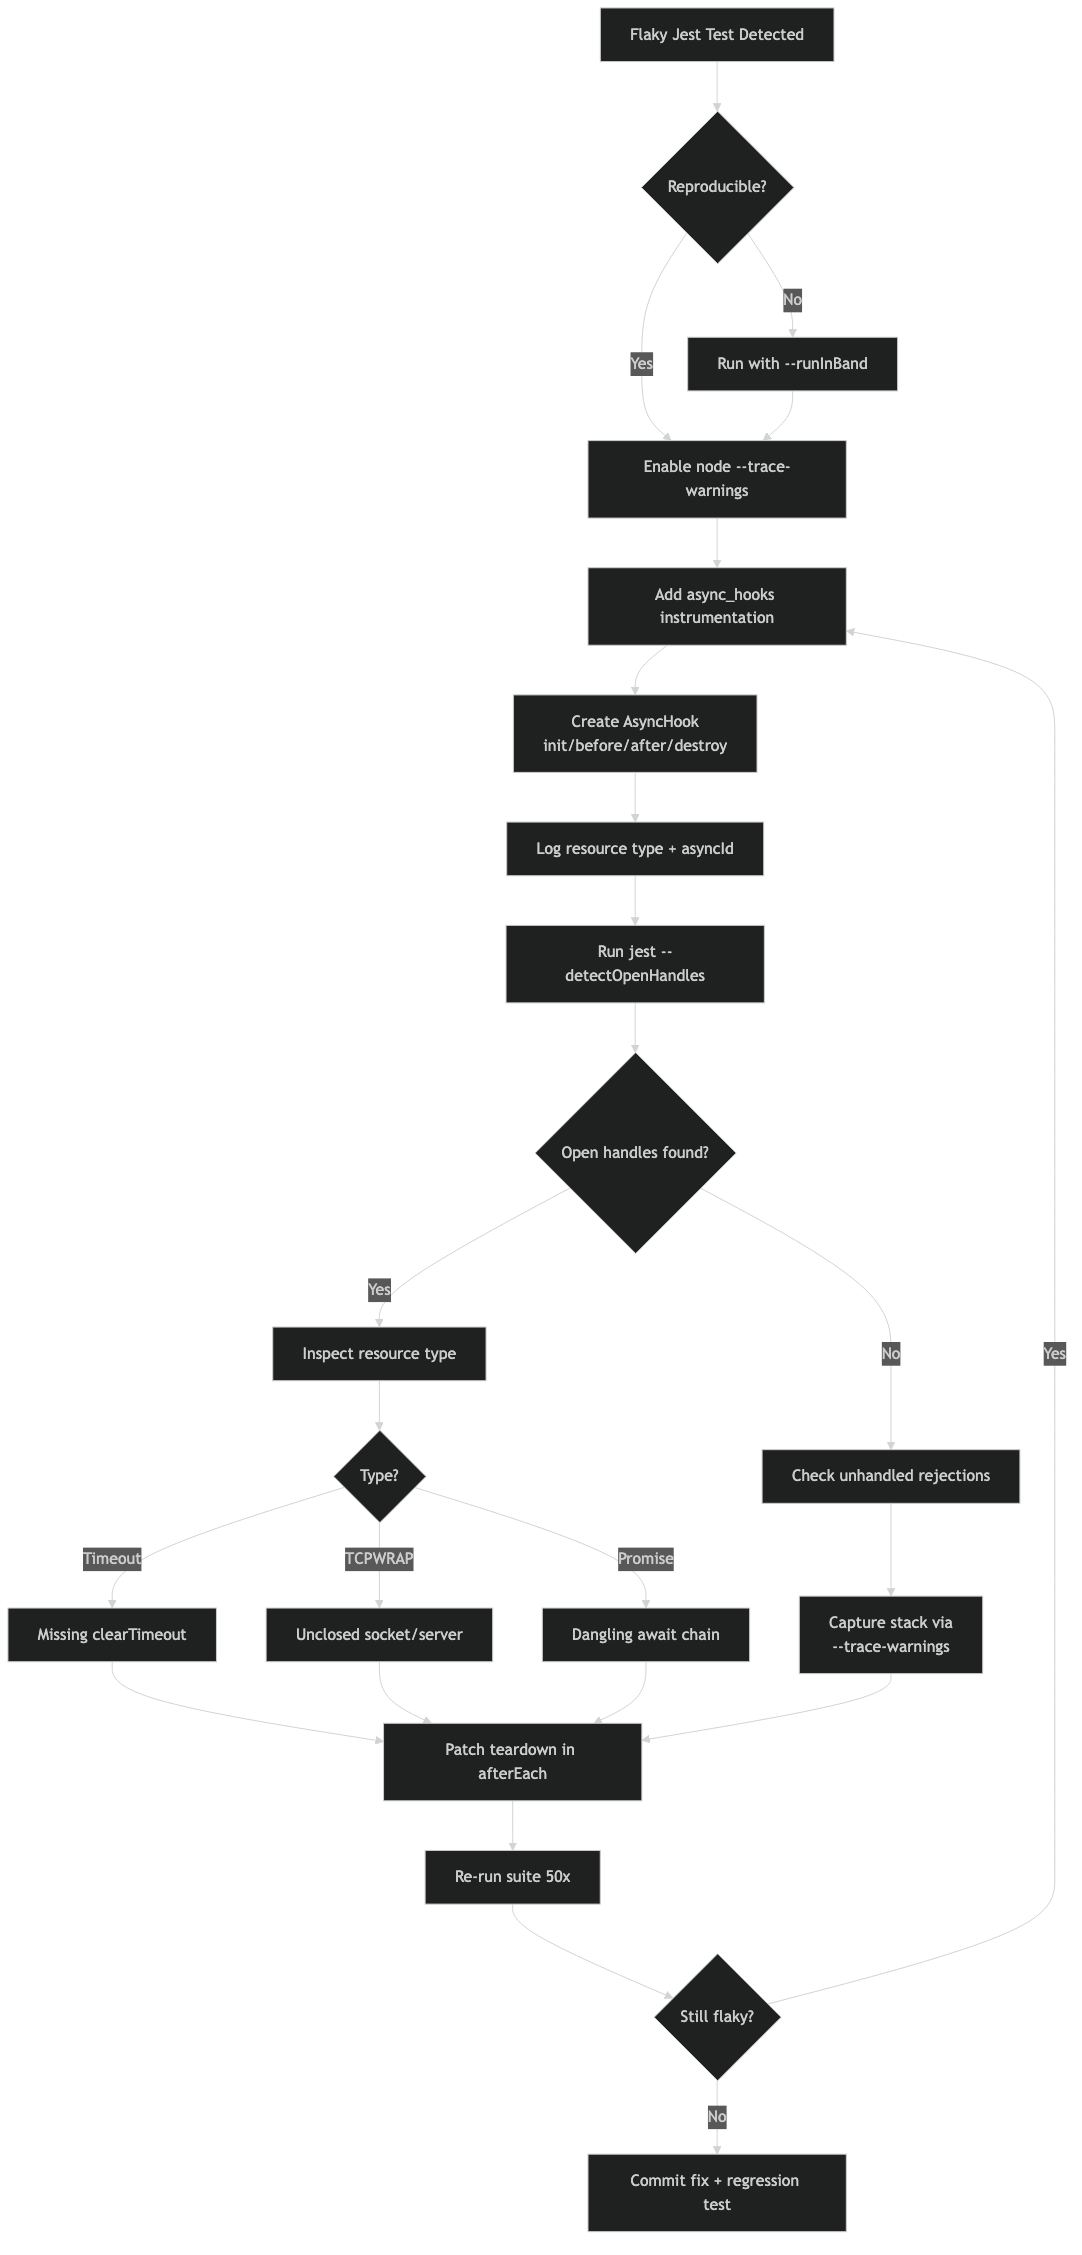
The diagram shows the flow for a single failing test: the Jest worker loads a module that calls setInterval, the async_hooks init callback records the timer’s asyncId with a stack trace and the current AsyncLocalStorage test name, Jest’s lifecycle fires afterEach without stopping the timer, and the beforeExit handler walks the live map and prints the surviving entry. The important arrow is the one from afterEach back to the live map — that is where you decide whether a leak is “ended this test” (a real bug) or “will be cleaned up later” (usually acceptable for shared fixtures).
A short checklist for chasing one down
When a suite starts going red intermittently, the cheapest path is this: run it once locally with NODE_OPTIONS="--trace-warnings" and --runInBand --detectOpenHandles; if that names a file, fix it and move on. If the warning fires without a clear stack, or the report is empty but the worker hangs for the full forceExit timeout, drop in the 15-line createHook helper above and rerun. If you still cannot see the leak, the problem is almost always inside a native addon or a worker_threads child — at that point switch to node --inspect-brk and attach Chrome DevTools to the worker process directly.
The one habit that prevents most of this pain is to never create timers, sockets, or pools at module load. Export a factory, call it from an explicit beforeAll, and tear it down in afterAll. That single rule eliminates the majority of flaky jest tests async hooks investigations before they start, and it costs nothing to adopt.
Questions readers ask
Why do Jest tests pass 49 times and fail on the 50th?
A Jest suite that fails intermittently is almost always caused by an async leak — a timer, socket, database pool, or promise chain that outlives the test that spawned it. Jest resets module state between tests but cannot reset the Node event loop, so handles scheduled inside module-level singletons survive afterEach and fire callbacks against reset modules on subsequent runs, producing errors that look like nondeterminism but are actually deterministic leaks.
How do I enable –trace-warnings when running Jest?
The –trace-warnings flag lives on the node binary, not on Jest, so you pass it through NODE_OPTIONS. Run: NODE_OPTIONS=”–trace-warnings –unhandled-rejections=strict” npx jest –runInBand –detectOpenHandles path/to/flaky.test.ts. The –runInBand flag forces a single worker so stack traces aren’t interleaved, –detectOpenHandles reports open handles, and –unhandled-rejections=strict promotes silent rejected promises into crashes for easier diagnosis.
Why can’t I use console.log inside an async_hooks callback?
console.log is itself asynchronous, so calling it inside an async hook’s init or destroy callback recursively fires the hook and causes the script to hang. This is documented behaviour in the Node async_hooks reference and is the single most common reason homegrown hook scripts break. Always use fs.writeSync(1, …) to reach stdout directly from inside hook callbacks.
How can I find which Jest test spawned a leaked async handle?
Combine AsyncLocalStorage with async_hooks. In a beforeEach, call als.enterWith({ testName: expect.getState().currentTestName }) to stash the current test name into request-scoped context. Because AsyncLocalStorage propagates through the same async resource graph async_hooks watches, calling als.getStore() inside your hook’s init callback reports the exact it() block that spawned the leaked handle, not just the file.
References
- Node.js async_hooks API reference — authoritative documentation for
createHook, theinit/destroylifecycle, and the warning thatconsole.loginside a hook will recurse. - Node.js CLI reference for –trace-warnings — the official description of the flag, confirming it prints stack traces for all process warnings including
UnhandledPromiseRejectionWarning. - Jest CLI documentation for –detectOpenHandles — the source for Jest’s handle-detection behaviour and its stated performance cost.
- Node.js AsyncLocalStorage class reference — supports the claim that
AsyncLocalStoragepropagates through the same async resource graph thatasync_hooksobserves. - facebook/jest on GitHub — issue tracker where limitations of
--detectOpenHandlesagainstundici,worker_threads, and native addons are discussed by maintainers. - Node.js Timeout.unref() reference — cited for the recommendation to unref health-check intervals that should not block process exit.