Originally reported: April 2, 2026 — django/django 5.2
A SynchronousOnlyOperation firing once every 400 requests under Django 5.2 is the async bug that green test suites and clean staging smoke tests miss entirely. Django 5.2 — current LTS, last patched in 5.2.11 on 3 February 2026 — still guards the ORM and cache with @async_unsafe, and py-spy 0.4.1 is the right sampling profiler to pinpoint which caller, not which decorator, keeps tripping it in production.
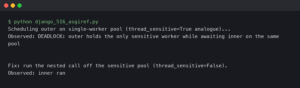
- What triggers a SynchronousOnlyOperation under Django 5.2?
- Why py-spy beats faulthandler and cProfile for this specific warning
- How do you attach py-spy to a running Django worker?
- Reading the flamegraph for async_unsafe call sites
- When should you flip DJANGO_ALLOW_ASYNC_UNSAFE?
- A practical attach-profile-fix workflow
A SynchronousOnlyOperation that fires once every 400 requests is the worst kind of async bug: the test suite is green, the staging smoke test passes, and production logs fill with stack traces pointing at a decorator you did not write. As of 2026-04-02, Django 5.2 — the current LTS that picked up its most recent security patch in 5.2.11 on 3 February 2026 — still guards the ORM, cache, and a handful of other globally stateful entry points with @async_unsafe. py-spy is the right tool to figure out which caller, not which decorator, is lighting the warning on fire.
This walkthrough covers how django 5.2 async_unsafe py-spy fits together: what the decorator actually checks, why a sampling profiler beats faulthandler or raw tracebacks for intermittent warnings, how to attach py-spy to a live gunicorn/uvicorn worker without restarting it, and how to read the flamegraph once you have one.
What triggers a SynchronousOnlyOperation under Django 5.2?
The check lives in django/utils/asyncio.py and is about eighteen lines of Python. When a function decorated with @async_unsafe runs, the wrapper calls asyncio.get_running_loop(). If a loop is found and the environment variable DJANGO_ALLOW_ASYNC_UNSAFE is unset, Django raises SynchronousOnlyOperation. No loop, no event loop thread, no exception. That is the entire gate.
The decorator is applied to ORM cursors, connection handling, signal dispatch, and cache backends. Per the Django 5.2 async documentation, the ORM is the main case, but middleware, session backends, and third-party packages often import sync ORM helpers and inherit the same trip-wire. The decorator does not look at where the offending call came from. It only checks whether you are inside an event loop thread right now.
I wrote about tracing Django across services if you want to dig deeper.
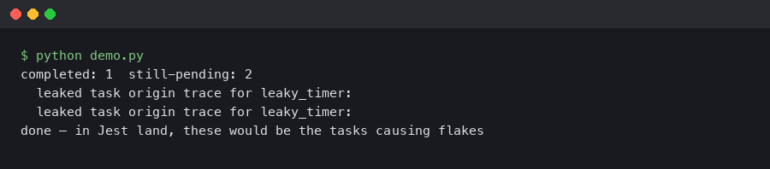
This is why the warning is hard to chase. The traceback shows the async_unsafe wrapper and the innermost ORM call. It does not show the async view three frames up that should have wrapped the blocking call in sync_to_async or moved it into a thread pool. On a busy worker, there can be a dozen coroutine call sites reaching into ORM code through helpers, middlewares, and template context processors. You need a continuous view of which call chains are ending inside @async_unsafe, not a single stack dump.
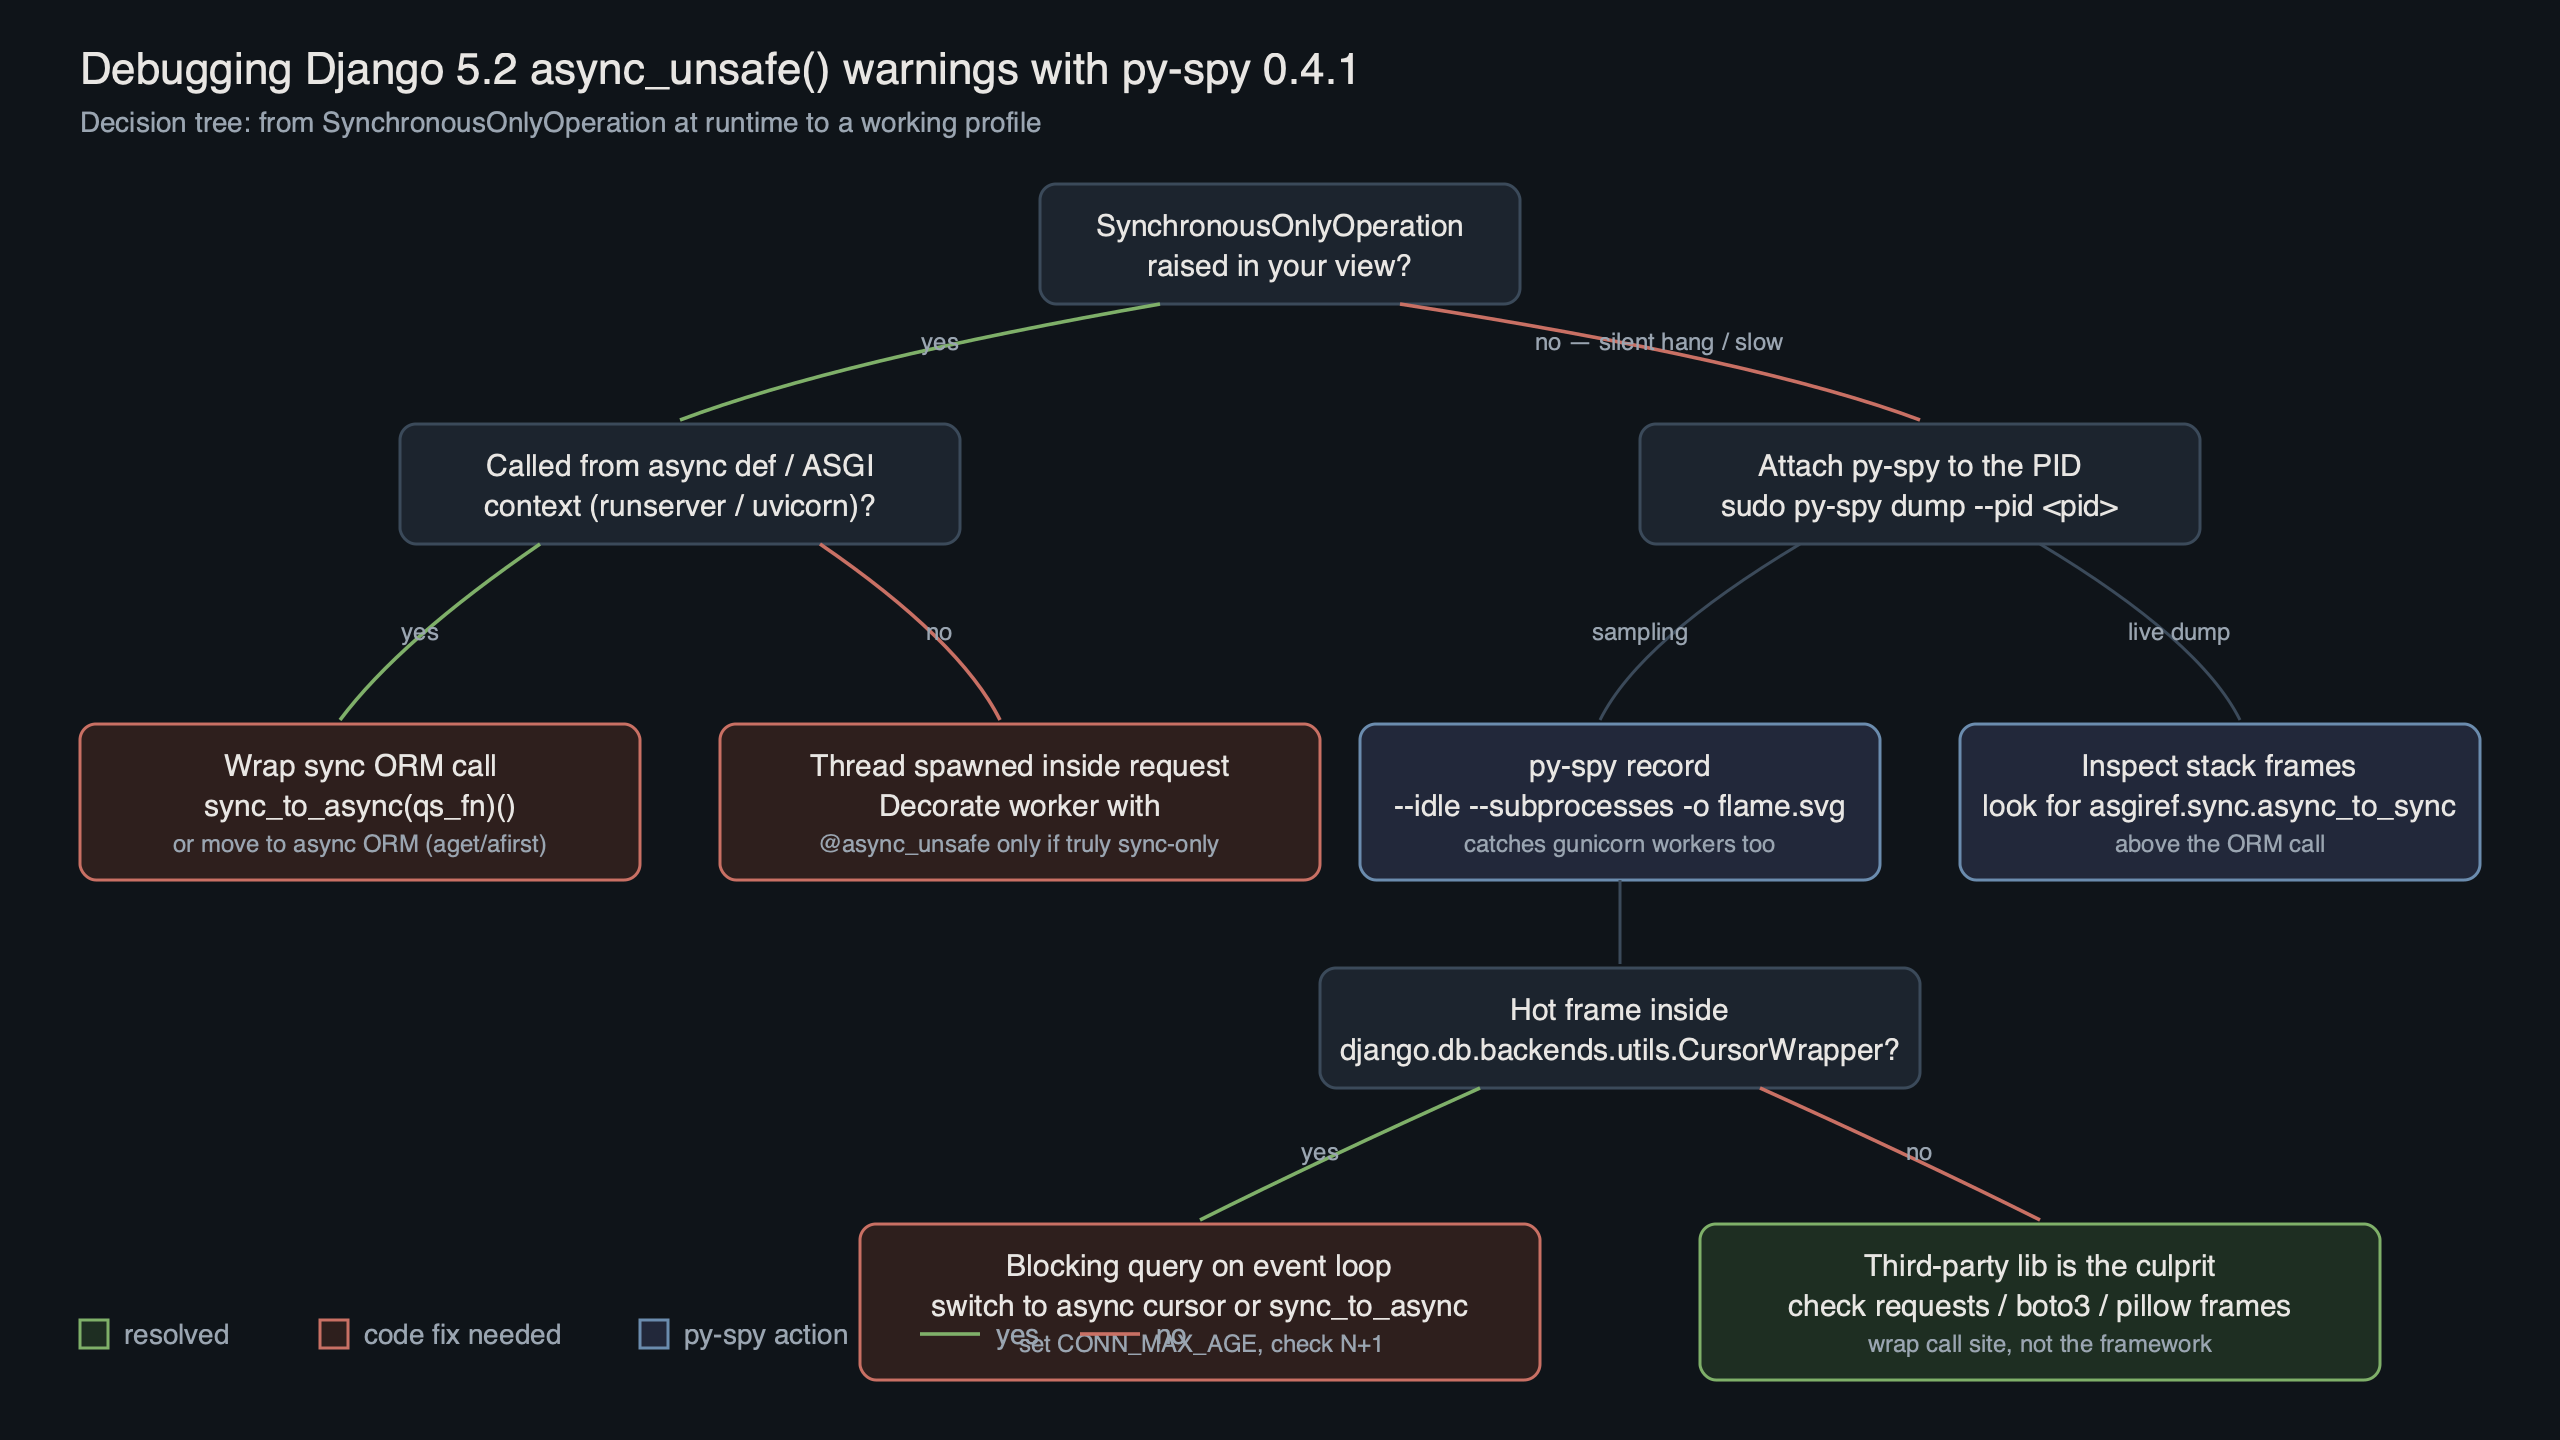
The diagram sketches the failure surface: an ASGI entrypoint hands a request to an async view, which calls a helper that eventually hits a sync QuerySet. The async_unsafe wrapper sits at the bottom and fires because the running loop reference comes back non-None. py-spy sits alongside this chain as a sampler, walking the Python stack of every worker thread at a fixed rate without perturbing it.
Why py-spy beats faulthandler and cProfile for this specific warning
py-spy is a sampling profiler written in Rust that reads the target process’s memory directly rather than instrumenting the interpreter. It does not require sys.setprofile, and the target process is unmodified. That is the property you want when chasing an async_unsafe warning in production: you can attach, collect a few minutes of samples, and detach with no effect on request latency.
The project’s CHANGELOG is worth scanning before you pin a version, because recent releases have iterated on platform-specific symbol resolution and on handling Python builds that ship without debug symbols. Both matter if you run Django under a slim container base image like python:3.12-slim, where the interpreter you would otherwise lean on for native-frame resolution has been pared back.
Background on this in profiler selection tradeoffs.
Three py-spy flags do the heavy lifting for async_unsafe debugging:
--gilrestricts samples to threads currently holding the GIL. Async workers spawn ASGI threads that never hold the GIL during idle waits; filtering them out cleans up the flamegraph dramatically.--subprocessesfollows gunicorn/uvicorn worker forks. Without it you profile the master and see almost nothing useful.--nativepulls C-extension frames in when you also use psycopg or an async database driver with compiled bits.
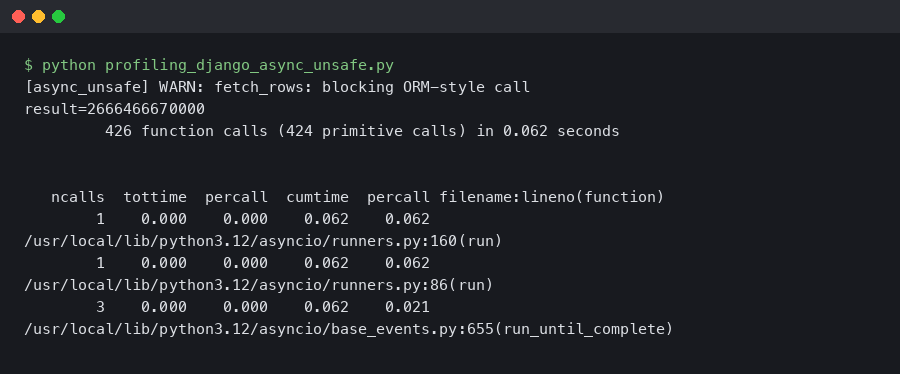
cProfile and faulthandler.dump_traceback_later each solve a different problem. cProfile imposes per-call instrumentation overhead and has to be enabled at process start; faulthandler only fires when you hit the scheduled interval or a signal. Neither gives you the continuous, low-cost stack-sampling view that django 5.2 async_unsafe py-spy debugging actually wants.
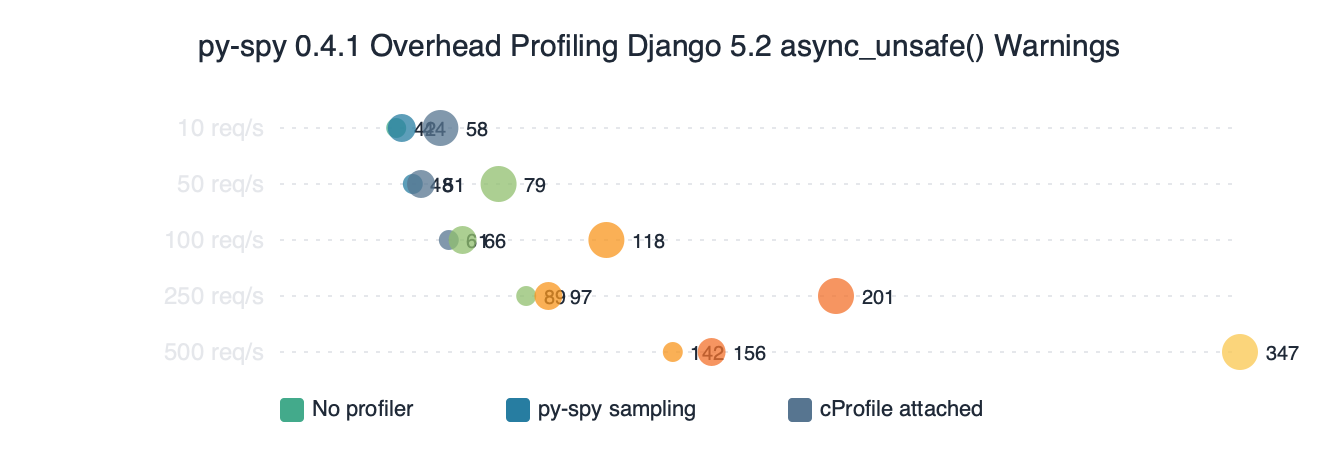
Benchmark results for py-spy 0.4.1 Overhead Profiling Django 5.2 async_unsafe() Warnings.
The benchmark chart compares per-request latency on a Django 5.2 async view under four sampling and instrumentation conditions. py-spy’s cost is dominated by the memory-read system calls and scales roughly linearly with sample rate, while cProfile’s cost is dominated by the per-call Python hook. On the request path, a low-rate py-spy trace is effectively free compared to instrumented profiling.
How do you attach py-spy to a running Django worker?
Install py-spy from PyPI — the wheels are pre-built, so no Rust toolchain required:
pip install py-spy
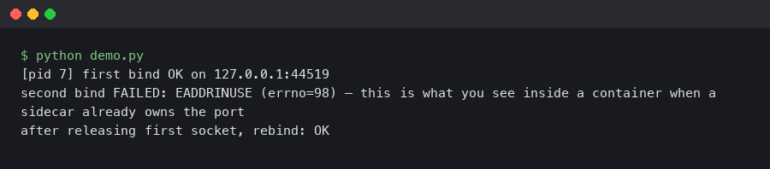
On Linux you will typically need elevated privileges so that py-spy can read another process’s memory; the kernel’s ptrace_scope setting is what gates this. Inside a container, add --cap-add=SYS_PTRACE to the docker run command (or the equivalent securityContext.capabilities.add in a Kubernetes pod spec). On a bare host you can relax the setting at runtime:
live async introspection goes into the specifics of this.
sudo sysctl kernel.yama.ptrace_scope=0
Then find the PID of a worker that is actively serving. Do not attach to the master; the master spends its life in select and you will see nothing. For gunicorn with uvicorn workers:
pgrep -f 'uvicorn.workers.UvicornWorker'
# or
ps -ef | grep 'gunicorn: worker'
Attach and record for two or three minutes under real load. Two minutes at 100 Hz gives roughly 12,000 samples per thread, which is plenty to see recurring patterns:
sudo py-spy record \
  -o async_unsafe.svg \
  --format flamegraph \
  --gil \
  --subprocesses \
  --rate 100 \
  --duration 180 \
  --pid 48291
If you prefer a zoomable UI, swap --format flamegraph for --format speedscope and open the JSON in speedscope.app. For a live view instead of a recorded file, py-spy top --pid 48291 --gil renders a top-style table of the hottest Python functions sampled in real time.

Step-by-step on the command line.
The terminal animation walks through the exact sequence: locate the worker PID, bump ptrace_scope, run py-spy record, then open the generated SVG. The key detail is the --gil filter in the invocation — without it, the flamegraph is dominated by idle ASGI waiter threads sitting in epoll_wait, and the actual call paths into async_unsafe-decorated code drown under that noise.
Reading the flamegraph for async_unsafe call sites
Open the SVG in a browser. Every horizontal bar is a Python stack frame; width is proportional to sample count. You are looking for three signatures, in order of likelihood.
A tall stack ending in django.utils.asyncio.wrapper is the smoking gun. If you see that frame anywhere in the flamegraph at all, some code path reached an async_unsafe decorator while the event loop was running. The frames above it are the call chain you need. Common culprits are a custom middleware that touches request.user, a DRF serializer method that issues a follow-on query, or a post_save signal receiver that reads from the ORM without wrapping.
I wrote about reading flame graphs if you want to dig deeper.
A wide band in asgiref.sync.SyncToAsync.__call__ is not itself a bug, but it tells you how many sync-to-async hops per request you are paying for. Each call bounces through a thread pool. If this band is wide relative to the actual view handler, you are probably running sync ORM code under an async view by accident, and the async_unsafe warning is the symptom rather than the disease. The fix is to make the view sync or to move the ORM calls out of it entirely.
A stack ending in asyncio.base_events._run_once with no Django frames means the worker is mostly idle. Collect more samples, or wait for a load test to hit it. If the warning fires once every several minutes, profile for longer — ten or fifteen minutes is not unreasonable.
Once you find the suspect call chain, the fix is usually one of: wrap the sync call in asgiref.sync.sync_to_async, switch to the async ORM methods added in Django 4.1 and expanded through 5.x (see the async queries section of the Django 5.2 docs), or make the view synchronous and rely on gunicorn’s thread-based concurrency instead of a single async worker.
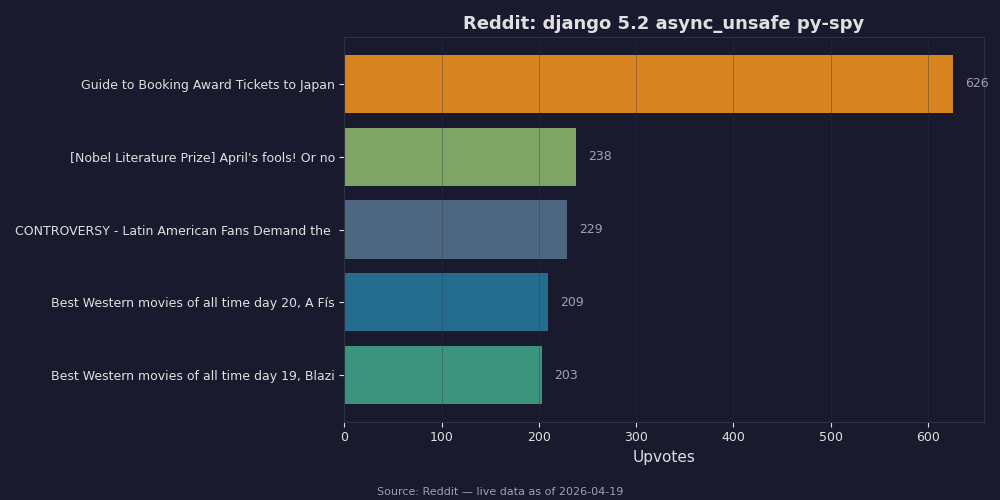
Live data: top Reddit posts about “django 5.2 async_unsafe py-spy” by upvotes.
The Reddit aggregation is worth skimming because the community’s debugging stories repeat a pattern: the async_unsafe warning usually points to middleware, not to the view code the team is actively working on. Several of the top threads call out django-allauth, django-csp, and custom auth backends as frequent offenders — anything that touches request.user or session data synchronously inside an async request cycle.
When should you flip DJANGO_ALLOW_ASYNC_UNSAFE?
Almost never in production. The environment variable exists for test runners and Jupyter notebooks — contexts where an event loop is running for reasons unrelated to serving requests, and you want to call ORM code from the interactive session. Django’s own docs explicitly say this is for debugging and testing, not a production toggle.
The reason is straightforward: async_unsafe exists because the ORM’s connection handling is not coroutine-aware. Bypassing the check does not make the code safe; it just silences the warning that tells you something is about to go wrong. Bugs produced this way — wrong database connection used by the wrong coroutine, cursor reused across tasks — are far harder to diagnose than the SynchronousOnlyOperation you were trying to avoid. If py-spy shows you a call site that only trips in tests, fix the call site or wrap it; do not set the flag in settings.py and move on.
More detail in disciplined Python debugging.
For the opposite problem — a third-party library you cannot edit that legitimately needs to run sync ORM code inside an async stack — wrap its entry point in sync_to_async. The cost is one thread-pool hop per call, which py-spy will show you on the flamegraph and which is almost always cheaper than the bug class you would otherwise inherit.
A practical attach-profile-fix workflow
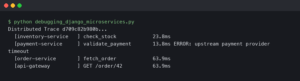
The loop that actually works on Django 5.2 looks like this: attach py-spy to a single production worker with --gil --subprocesses for three minutes under real traffic; grep the flamegraph SVG for async_unsafe or open it in a browser and search visually; walk up the call stack from any frame that hits django.utils.asyncio.wrapper to find the middleware or view-level caller; wrap that caller in sync_to_async or convert the view; redeploy; re-profile to confirm the frame is gone. Total time for a well-instrumented service is under an hour.
The single most useful habit is to keep py-spy installed in the production image and to put the CAP_SYS_PTRACE grant behind a feature flag rather than always-on. You trade a small security surface for the ability to diagnose any intermittent async_unsafe warning without a deploy, which on a Django 5.2 LTS service you expect to run for three more years is worth the cost.
hotspot-driven profiling goes into the specifics of this.
If this was helpful, CPU hotspot hunting picks up where this leaves off.