The Developer’s Dilemma: When Good Tests Go Bad
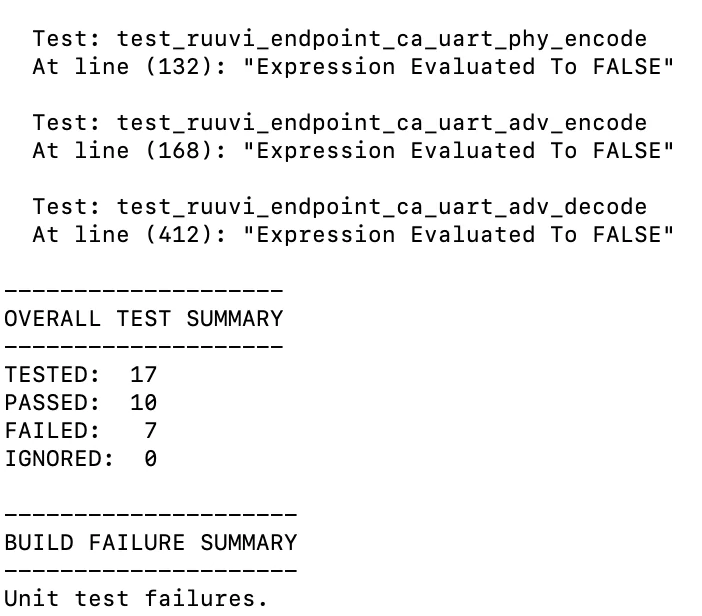
Every developer knows the feeling: you push your latest feature, the local tests pass with flying colors, and you create a pull request with confidence. Minutes later, a dreaded red ‘X’ appears next to your commit. The continuous integration (CI/CD) pipeline has failed. A unit test that worked perfectly on your machine is now broken, and the only clue is a cryptic log file. This scenario highlights a critical, often underestimated skill in modern software development: Unit Test Debugging.
Debugging a failing unit test is a unique challenge. It’s a two-front war where the bug could lie either in the application code you’re testing or in the test logic itself. Mastering this process is essential for maintaining a reliable test suite, accelerating development cycles, and building confidence in your codebase. Effective Testing and Debugging practices transform failing tests from frustrating roadblocks into valuable diagnostic tools. This article dives deep into the world of unit test debugging, covering fundamental principles, practical tools, advanced techniques for complex scenarios like async code and mocking, and best practices to make your bug-fixing process more efficient and less painful.
Understanding the “Why”: Core Principles of Unit Test Debugging
Before jumping into sophisticated debug tools, it’s crucial to understand the foundational concepts. The initial moments after a test failure are the most critical, as the clues provided by the test runner are your first and best guide to the root cause.
Why Is Debugging a Unit Test Different?
Unlike debugging a full application, unit tests operate in a controlled, isolated environment. This isolation is a double-edged sword. While it simplifies the scope, it introduces unique points of failure:
- The Dual Suspects: Is the error in the function being tested, or is the test itself flawed? A test might fail because it makes incorrect assumptions, uses faulty assertion logic, or has not been updated to reflect recent changes in the application code.
- The World of Mocks: Unit tests heavily rely on mocks, stubs, and spies to isolate components. A misconfigured mock—one that doesn’t return the expected value or doesn’t correctly simulate a function’s behavior—is a common source of test failures that can be tricky to diagnose.
- State and Environment: Tests often require specific initial states or environment configurations. A failure might stem from improperly set up test data or a missing environment variable, rather than a logic error.
Initial Triage: Interpreting Error Messages and Stack Traces
Your first step should always be to carefully read the output from your test runner. Don’t just glance at it; dissect it. The error message and stack trace are packed with information. Let’s look at a practical example in Python using the pytest framework.
Imagine we have a simple function to format user data:
def format_user_display(user):
    """Formats a user dictionary for display."""
    if "first_name" not in user or "last_name" not in user:
        return "Anonymous"
    # Intentional bug: incorrect key used
    return f'{user["first_name"]} {user["last_namee"]}'
And here is our failing unit test:
def test_format_user_display_with_full_name():
    """Tests the user display format with a complete user object."""
    user = {"first_name": "Jane", "last_name": "Doe"}
    expected = "Jane Doe"
    # This assertion will fail
    assert format_user_display(user) == expected
When you run this with pytest, the output will point directly to the problem. It won’t just say “test failed.” It will show a detailed stack trace leading to a KeyError: 'last_namee'. This immediately tells you the problem isn’t with the assertion logic in the test, but with how the format_user_display function is accessing the dictionary. This initial analysis of Error Messages and Stack Traces saves immense time and prevents you from chasing ghosts in your test code.
The Debugger’s Toolkit: Practical Techniques and Tools
Once you’ve analyzed the initial output, it’s time to dig deeper. While simple print statements can be useful, leveraging interactive debuggers provides a far more powerful and efficient experience for any kind of Code Debugging, whether it’s Python Debugging or JavaScript Debugging.
The Humble `print()`: A Quick First Step
The simplest form of debugging is adding `print()` or `console.log()` statements to inspect the state of variables at different points in your code. It’s fast, requires no special tools, and can be effective for simple problems. However, it has significant drawbacks: it’s a manual process, it clutters your code, and you have to re-run the test every time you want to inspect a different value. It’s a good tool for a quick sanity check but falls short for complex issues.
Leveling Up with Interactive Debuggers
Interactive debuggers are the cornerstone of modern Software Debugging. They allow you to pause your code’s execution at specific points (breakpoints) and inspect the entire application state, including local variables, the call stack, and more. You can then execute your code line by line, stepping into or over functions to understand the exact flow of logic.
Let’s consider a JavaScript example using Jest. We have a function that is supposed to filter out inactive users and return their emails.
// userService.js
export function getActiveUserEmails(users) {
  // Bug: filter condition is incorrect, it keeps inactive users
  return users
    .filter(user => user.status = 'inactive')
    .map(user => user.email);
}
Our Jest test fails because it receives the wrong emails:
// userService.test.js
import { getActiveUserEmails } from './userService';

test('should return emails of active users only', () => {
  const users = [
    { email: '[email protected]', status: 'active' },
    { email: '[email protected]', status: 'inactive' },
    { email: '[email protected]', status: 'active' },
  ];

  // Add a breakpoint in your code or IDE here
  debugger;

  const activeEmails = getActiveUserEmails(users);

  expect(activeEmails).toEqual(['[email protected]', '[email protected]']);
});
By adding the `debugger;` statement and running the test with a debugger attached (e.g., using the VS Code debugger or `node –inspect-brk`), the execution will pause. You can then step through the `.filter()` method and inspect the `user` object at each iteration. You would quickly see that the condition `user.status = ‘inactive’` is an assignment, not a comparison (`===`), which is a common source of JavaScript Errors. This level of interactive inspection is impossible with `console.log` alone and is a core practice for effective Node.js Debugging.
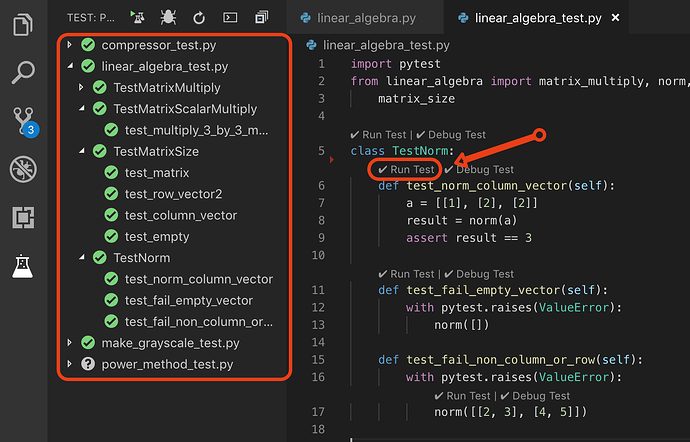
IDE Integration: The Power of Visual Debugging
Modern IDEs like Visual Studio Code, PyCharm, and WebStorm have powerful, integrated Developer Tools that make debugging seamless. Instead of manually starting a debugger from the command line, you can set breakpoints by simply clicking in the editor’s gutter. You can then run your test suite in “Debug Mode.” The IDE provides a rich UI to view variables, watch expressions, inspect the call stack, and control execution flow. Features like conditional breakpoints (e.g., “break only when `user.id === 123`”) are invaluable for debugging issues that only occur with specific data.
Tackling Complexity: Advanced Unit Test Debugging Scenarios
Real-world applications involve more than just simple, synchronous functions. Debugging tests for asynchronous operations, mocked dependencies, and code running in CI/CD pipelines requires more advanced strategies.
Debugging Mocks and Spies
Mocks are a frequent source of confusing test failures. The problem often isn’t the logic of your function but how it interacts with a mocked dependency. When a test involving a mock fails, ask these questions:
- Is the mock configured correctly? Does it return the value your function expects?
- Is the mocked function being called at all?
- Is it being called with the correct arguments?
Most mocking libraries provide assertion helpers to debug these interactions. For example, in Jest, you can inspect a mock function to see how it was used.
// api.js
export async function fetchUserDetails(userId) {
  // In reality, this would make a network request
  throw new Error("This should be mocked!");
}

// userProcessor.js
import { fetchUserDetails } from './api';

export async function processUser(userId) {
  const details = await fetchUserDetails(userId);
  if (details.subscription === 'premium') {
    return { ...details, canAccessFeatures: true };
  }
  return { ...details, canAccessFeatures: false };
}

// userProcessor.test.js
import { processUser } from './userProcessor';
import { fetchUserDetails } from './api';

jest.mock('./api'); // Mock the entire api module

test('processUser should grant access for premium users', async () => {
  // Bug: Mock is not returning the correct structure
  const mockUserData = { plan: 'premium' };
  fetchUserDetails.mockResolvedValue(mockUserData);

  const result = await processUser(1);

  // This will fail because result.canAccessFeatures will be false
  expect(fetchUserDetails).toHaveBeenCalledWith(1);
  expect(result.canAccessFeatures).toBe(true);
});
In this API Debugging example, the test fails because our code expects a `subscription` property, but the mock provides a `plan` property. Using the debugger, we could inspect the `details` variable inside `processUser`. Alternatively, by carefully reading the test, we can spot the mismatch between the mock’s implementation and the function’s expectation. This is a common pattern in Backend Debugging, especially when dealing with microservices or external APIs.
Navigating Asynchronous Code
Async Debugging presents its own set of challenges. Unhandled promise rejections, race conditions, and incorrect `async/await` usage can lead to tests that fail silently or time out. Modern debuggers and test frameworks have vastly improved their handling of asynchronous code. The “Call Stack” panel in tools like Chrome DevTools now often shows the full “async stack,” tracing execution back through the chain of `await` calls. Key tips for debugging async tests include:
- Always `await` promises returned by your functions within your tests.
- Ensure your test function is marked as `async`.
- Use your debugger’s features for handling asynchronous operations, like “step over await.”
Debugging in a CI/CD Environment
Perhaps the most challenging scenario is CI/CD Debugging, where you can’t attach an interactive debugger. The strategy here shifts from interactive inspection to forensic analysis:
- Enhanced Logging: Add detailed, structured logs to your code and tests. Log the inputs, key intermediate states, and outputs. Most CI systems collect these logs as artifacts.
- Artifacts on Failure: Configure your CI pipeline to save relevant files (e.g., a JSON dump of a complex object, screenshots for UI tests) as artifacts when a test fails.
- Reproduce Locally: The ultimate goal is to reproduce the failure on your local machine where you can use your full suite of Debug Tools. Pay close attention to differences in environment, such as Node.js/Python versions, dependencies, or environment variables. Running tests inside a Docker container that mirrors the CI environment is a powerful technique for this.
Proactive Strategies and the AI-Powered Future
The best way to fix bugs quickly is to prevent them—or at least make them easier to find. Adhering to Debugging Best Practices and leveraging modern tools can dramatically reduce the time spent on debugging.
Writing Debuggable Tests
A proactive approach starts with how you write your tests. A well-written test often makes the cause of a failure immediately obvious.
- Be Specific: Write small, focused tests that check one thing. A test named `test_user_login_with_invalid_password` is far more informative than `test_user_login`.
- Clear Assertions: Use descriptive assertion messages. Instead of `assert result is True`, use `assert result is True, “Expected user to be authenticated after login”`.
- Avoid Logic in Tests: Keep your test logic simple and linear. Complex loops or conditionals in a test are a red flag; they make the test itself another piece of code you have to debug.
The Rise of AI-Assisted Debugging
The landscape of Application Debugging is rapidly evolving with the integration of AI. Tools powered by large language models are now being built directly into IDEs and testing frameworks. These AI assistants can supercharge your debugging workflow by:
- Explaining Errors: They can analyze complex error messages and stack traces and explain them in plain language.
- Suggesting Fixes: For common Python Errors or Node.js Errors, AI can often propose a correct code snippet.
- Generating Debugging Plans: When faced with a failing test, these tools can suggest a step-by-step plan, recommending which variables to watch and where to place breakpoints.
- Analyzing State: Some advanced tools can analyze the state of your variables at the point of failure and highlight the specific value that caused the issue.
These AI-powered features act as an intelligent partner, augmenting a developer’s skills rather than replacing them. They accelerate the process of Code Analysis and allow developers to focus more on the logic and less on the mechanics of debugging.
Conclusion: From Frustration to Insight
Unit test debugging is an essential skill that separates good developers from great ones. It’s a discipline that combines systematic thinking, a deep understanding of your tools, and a proactive mindset. By moving beyond simple print statements and embracing the power of interactive debuggers, you can transform a failing test from a source of frustration into a precise instrument that pinpoints flaws in your code.
The key takeaways are clear: start by carefully analyzing the test runner’s output, leverage the full power of your IDE’s integrated debugger, and adopt advanced strategies for complex scenarios like mocks and asynchronous code. Most importantly, write clear, simple, and focused tests from the beginning. As development tools continue to evolve with AI assistance, the process of Bug Fixing will only become more efficient, allowing you to build more robust and reliable software faster than ever before.